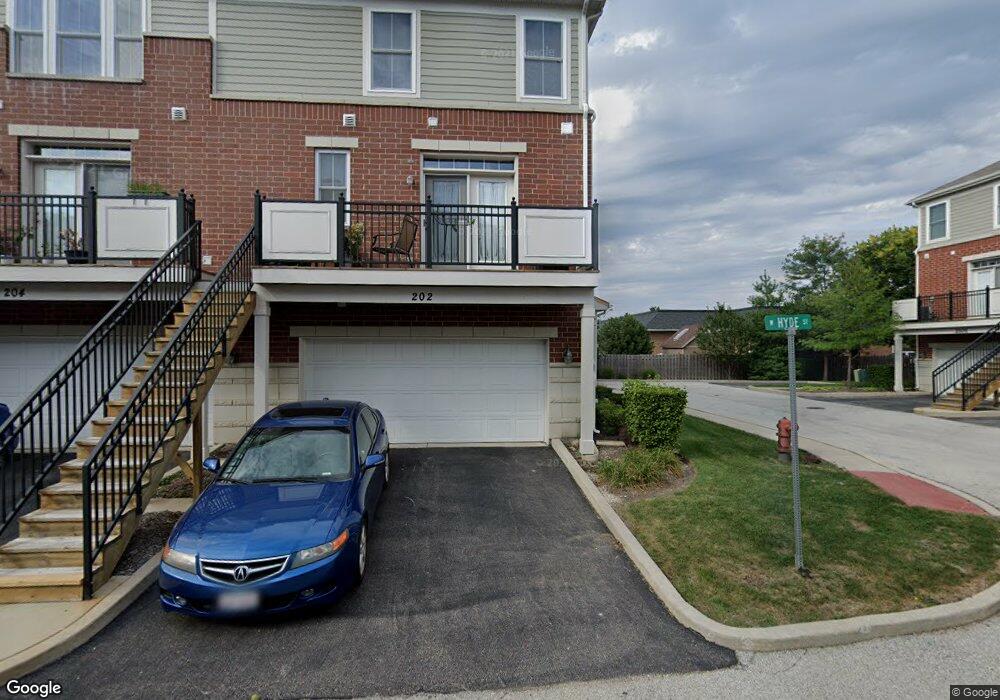
202 W Hyde St Unit 9-1 Arlington Heights, IL 60005
Estimated Value: $399,834 - $461,000
3
Beds
4
Baths
2,025
Sq Ft
$212/Sq Ft
Est. Value
About This Home
This home is located at 202 W Hyde St Unit 9-1, Arlington Heights, IL 60005 and is currently estimated at $429,945, approximately $212 per square foot. 202 W Hyde St Unit 9-1 is a home located in Cook County with nearby schools including Holmes Jr High School, Juliette Low Elementary School, and Rolling Meadows High School.
Ownership History
Date
Name
Owned For
Owner Type
Purchase Details
Closed on
Feb 28, 2011
Sold by
Lennar Communities Of Chicago Llc
Bought by
Qin Qiong and Gu Qing
Current Estimated Value
Home Financials for this Owner
Home Financials are based on the most recent Mortgage that was taken out on this home.
Original Mortgage
$198,750
Outstanding Balance
$136,946
Interest Rate
4.85%
Mortgage Type
New Conventional
Estimated Equity
$292,999
Create a Home Valuation Report for This Property
The Home Valuation Report is an in-depth analysis detailing your home's value as well as a comparison with similar homes in the area
Home Values in the Area
Average Home Value in this Area
Purchase History
| Date | Buyer | Sale Price | Title Company |
|---|---|---|---|
| Qin Qiong | $265,000 | Nat |
Source: Public Records
Mortgage History
| Date | Status | Borrower | Loan Amount |
|---|---|---|---|
| Open | Qin Qiong | $198,750 |
Source: Public Records
Tax History Compared to Growth
Tax History
| Year | Tax Paid | Tax Assessment Tax Assessment Total Assessment is a certain percentage of the fair market value that is determined by local assessors to be the total taxable value of land and additions on the property. | Land | Improvement |
|---|---|---|---|---|
| 2024 | $7,380 | $28,532 | $4,132 | $24,400 |
| 2023 | $7,042 | $28,532 | $4,132 | $24,400 |
| 2022 | $7,042 | $28,532 | $4,132 | $24,400 |
| 2021 | $7,387 | $26,139 | $2,711 | $23,428 |
| 2020 | $7,176 | $26,139 | $2,711 | $23,428 |
| 2019 | $3,470 | $13,952 | $2,711 | $11,241 |
| 2018 | $7,148 | $25,559 | $2,324 | $23,235 |
| 2017 | $7,045 | $25,559 | $2,324 | $23,235 |
| 2016 | $6,781 | $26,291 | $2,324 | $23,967 |
| 2015 | $7,522 | $27,119 | $2,065 | $25,054 |
| 2014 | $7,425 | $27,119 | $2,065 | $25,054 |
| 2013 | $7,245 | $27,119 | $2,065 | $25,054 |
Source: Public Records
Map
Nearby Homes
- 2234 S Crambourne Way
- 1708 S Fernandez Ave
- 2206 S Goebbert Rd Unit 409
- 1607 S Kaspar Ave
- 2315 S Goebbert Rd Unit D209
- 700 S Noah Terrace
- 1535 S Douglas Ave
- 2342 S Shag Bark Trail
- 1355 S Dunton Ave
- 1020 Arbor Ct
- 1008 Arbor Ct
- 1016 Arbor Ct
- 1306 S Walnut Ave
- 2121 W Haven St
- 601 S Saint Cecilia Dr
- 2669 S Embers Ln Unit 142669
- 808 S Deborah Ln
- 1107 W White Oak St
- 1822 W Pheasant Trail
- 2736 S Embers Ln Unit 2736
- 204 W Hyde St Unit 9-2
- 201 W Hyde St
- 206 W Hyde St
- 207 W Hyde St
- 205 W Hyde St Unit 10-2
- 2111 S Montague Blvd
- 2105 S Montague Blvd
- 2107 S Montague Blvd
- 2101 S Montague Blvd Unit 11-7
- 2101 S Montague Blvd
- 208 W Hyde St Unit 9-4
- 211 W Hyde St
- 211 W Hyde St Unit 7
- 211 W Hyde St Unit 7-4
- 220 W Hyde St
- 220 W Hyde St Unit 8-1
- 222 W Hyde St
- 222 W Hyde St Unit 8-2
- 215 W Hyde St
- 224 W Hyde St Unit 8-3