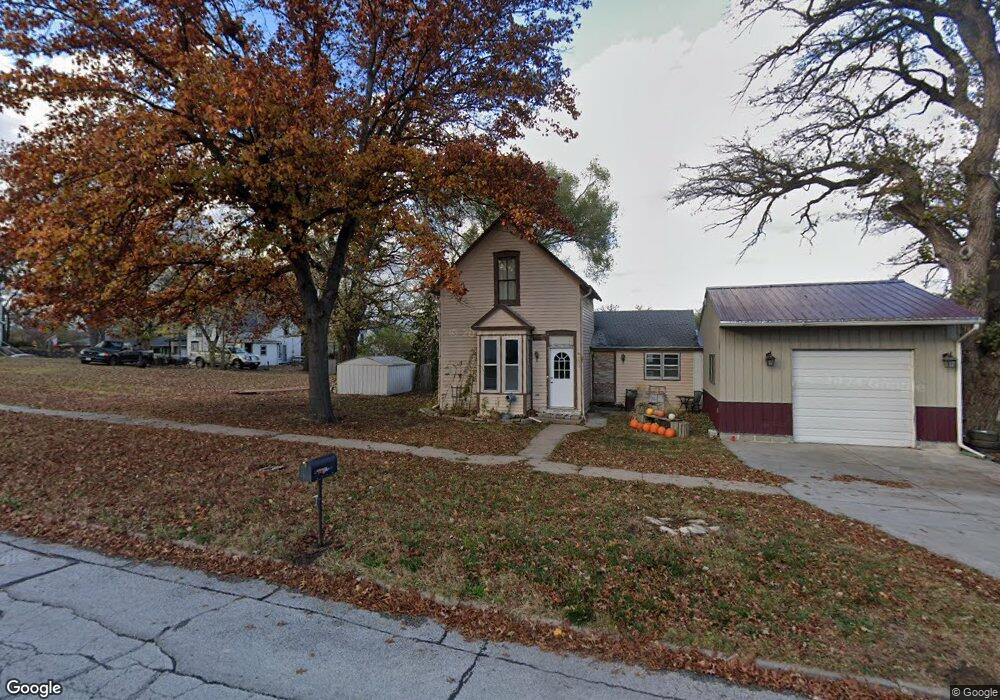
202 W M St Weeping Water, NE 68463
Estimated Value: $74,000 - $108,000
2
Beds
1
Bath
1,105
Sq Ft
$83/Sq Ft
Est. Value
About This Home
This home is located at 202 W M St, Weeping Water, NE 68463 and is currently estimated at $92,090, approximately $83 per square foot. 202 W M St is a home located in Cass County with nearby schools including Weeping Water Elementary School, Weeping Water Middle School, and Weeping Water High School.
Ownership History
Date
Name
Owned For
Owner Type
Purchase Details
Closed on
Mar 20, 2025
Sold by
Markham Rebecca J
Bought by
Gomez-Eloge Ricky
Current Estimated Value
Home Financials for this Owner
Home Financials are based on the most recent Mortgage that was taken out on this home.
Original Mortgage
$71,250
Outstanding Balance
$70,885
Interest Rate
6.87%
Mortgage Type
New Conventional
Estimated Equity
$21,205
Purchase Details
Closed on
Aug 17, 2022
Sold by
Markham Lora J
Bought by
Markham Rebecca J
Purchase Details
Closed on
Aug 25, 2016
Sold by
Headlee Don and Headlee Sandra L
Bought by
Markham Lora J
Create a Home Valuation Report for This Property
The Home Valuation Report is an in-depth analysis detailing your home's value as well as a comparison with similar homes in the area
Home Values in the Area
Average Home Value in this Area
Purchase History
| Date | Buyer | Sale Price | Title Company |
|---|---|---|---|
| Gomez-Eloge Ricky | $75,000 | Nebraska Title | |
| Markham Rebecca J | $53,400 | -- | |
| Markham Lora J | -- | Attorney |
Source: Public Records
Mortgage History
| Date | Status | Borrower | Loan Amount |
|---|---|---|---|
| Open | Gomez-Eloge Ricky | $71,250 |
Source: Public Records
Tax History Compared to Growth
Tax History
| Year | Tax Paid | Tax Assessment Tax Assessment Total Assessment is a certain percentage of the fair market value that is determined by local assessors to be the total taxable value of land and additions on the property. | Land | Improvement |
|---|---|---|---|---|
| 2024 | $849 | $53,025 | $6,605 | $46,420 |
| 2023 | $1,039 | $52,157 | $5,737 | $46,420 |
| 2022 | $1,020 | $50,119 | $6,024 | $44,095 |
| 2021 | $993 | $47,732 | $5,737 | $41,995 |
| 2020 | $1,036 | $48,394 | $5,154 | $43,240 |
| 2019 | $970 | $45,228 | $4,817 | $40,411 |
| 2018 | $992 | $45,228 | $4,817 | $40,411 |
| 2017 | $982 | $45,228 | $4,817 | $40,411 |
| 2016 | $860 | $40,138 | $4,817 | $35,321 |
| 2015 | $854 | $40,138 | $4,817 | $35,321 |
| 2014 | $916 | $40,138 | $4,817 | $35,321 |
Source: Public Records
Map
Nearby Homes
- 400 S Randolph St
- 104 E O St
- 104 N East St
- 423 N Randolph St
- Lot 13, E Park St
- Lot 12, E Park St
- Lot 11, E Park St
- Lot 9, E Park St
- Lot 10, E Park St
- Lot 8, E Park St
- Lot 7, E Park St
- Lot 6, E Park St
- Lot 5, E Park St
- Lot 4, E Park St
- Lot 3, E Park St
- Lot 2, E Park St
- Lot 1, E Park St
- 303 E Park St
- Lot 1, Blk 3 Indian Dr
- Lot 2, Blk 3 Indian Dr