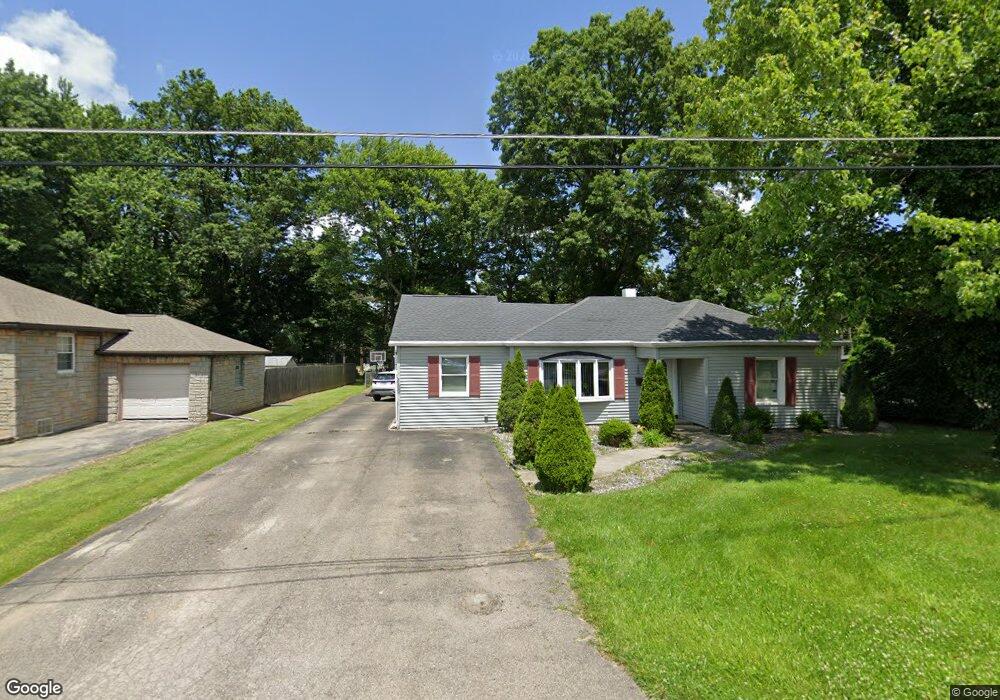
202 W Meyer Ave New Castle, PA 16105
Estimated Value: $192,672 - $235,000
3
Beds
2
Baths
1,795
Sq Ft
$119/Sq Ft
Est. Value
About This Home
This home is located at 202 W Meyer Ave, New Castle, PA 16105 and is currently estimated at $213,418, approximately $118 per square foot. 202 W Meyer Ave is a home located in Lawrence County with nearby schools including Neshannock Memorial Elementary School, Neshannock Junior/Senior High School, and St. Vitus School.
Ownership History
Date
Name
Owned For
Owner Type
Purchase Details
Closed on
Jan 27, 2012
Sold by
Horton Jesse C and Horton Frances J
Bought by
Cywnar Jeffrey D and Cywnar Leah P
Current Estimated Value
Home Financials for this Owner
Home Financials are based on the most recent Mortgage that was taken out on this home.
Original Mortgage
$70,000
Outstanding Balance
$48,026
Interest Rate
3.92%
Mortgage Type
New Conventional
Estimated Equity
$165,392
Purchase Details
Closed on
Aug 12, 2011
Sold by
Castleton Properties Llc
Bought by
Horton Jesse C and Horton Frances J
Purchase Details
Closed on
Jul 12, 2011
Sold by
Household Finance Consumer Discount Comp
Bought by
Castleton Properties Llc
Purchase Details
Closed on
Jan 19, 2011
Sold by
Burig Debra D
Bought by
Hsbc Finance Consumer Discount Company
Create a Home Valuation Report for This Property
The Home Valuation Report is an in-depth analysis detailing your home's value as well as a comparison with similar homes in the area
Home Values in the Area
Average Home Value in this Area
Purchase History
| Date | Buyer | Sale Price | Title Company |
|---|---|---|---|
| Cywnar Jeffrey D | $87,500 | None Available | |
| Horton Jesse C | $42,900 | None Available | |
| Castleton Properties Llc | $42,900 | None Available | |
| Hsbc Finance Consumer Discount Company | -- | None Available |
Source: Public Records
Mortgage History
| Date | Status | Borrower | Loan Amount |
|---|---|---|---|
| Open | Cywnar Jeffrey D | $70,000 |
Source: Public Records
Tax History Compared to Growth
Tax History
| Year | Tax Paid | Tax Assessment Tax Assessment Total Assessment is a certain percentage of the fair market value that is determined by local assessors to be the total taxable value of land and additions on the property. | Land | Improvement |
|---|---|---|---|---|
| 2025 | $3,044 | $95,300 | $13,800 | $81,500 |
| 2024 | $2,872 | $95,300 | $13,800 | $81,500 |
| 2023 | $2,769 | $95,300 | $13,800 | $81,500 |
| 2022 | $2,683 | $95,300 | $13,800 | $81,500 |
| 2021 | $2,683 | $95,300 | $13,800 | $81,500 |
| 2020 | $2,514 | $91,000 | $13,800 | $77,200 |
| 2019 | $2,383 | $91,000 | $13,800 | $77,200 |
| 2018 | $2,328 | $91,000 | $13,800 | $77,200 |
| 2017 | $2,227 | $91,000 | $13,800 | $77,200 |
| 2016 | $764 | $91,000 | $13,800 | $77,200 |
| 2015 | $764 | $91,000 | $13,800 | $77,200 |
| 2014 | $764 | $91,000 | $13,800 | $77,200 |
Source: Public Records
Map
Nearby Homes
- 306 W Meyer Ave
- 13 Edgewood Acres
- 310 W Meyer Ave
- 11 Manor Ave
- 5 Lilac Rd
- 201 E Hazelcroft Ave
- 1648 Katherine St
- 2516 Wilmington Rd
- 23 Bellaire Dr
- 2519 Wilmington Rd
- 232 E Elizabeth St
- 1416 Wilmington Rd
- 1501 N Mercer St
- 2560 Blossom Ln
- 2716 Albert St
- 2003 Highland Ave
- 103 W Garfield Ave
- 313 Norwood Ave
- 15 W Garfield Ave
- 2206 Highland Ave
- 200 W Meyer Ave
- 204 W Meyer Ave
- 196 W Meyer Ave
- 201 Moyer Rd
- 203 W Meyer Ave
- 199 W Meyer Ave
- 194 W Meyer Ave
- 205 W Meyer Ave
- 195 W Meyer Ave
- 210 W Meyer Ave
- 209 W Meyer Ave
- 192 W Meyer Ave
- 124 W Northview Ave
- 126 W Northview Ave
- 212 W Meyer Ave
- 202 W Northview Ave
- 204 W Northview Ave
- 193 W Meyer Ave
- 213 Moyer Rd
- 213 W Meyer Ave