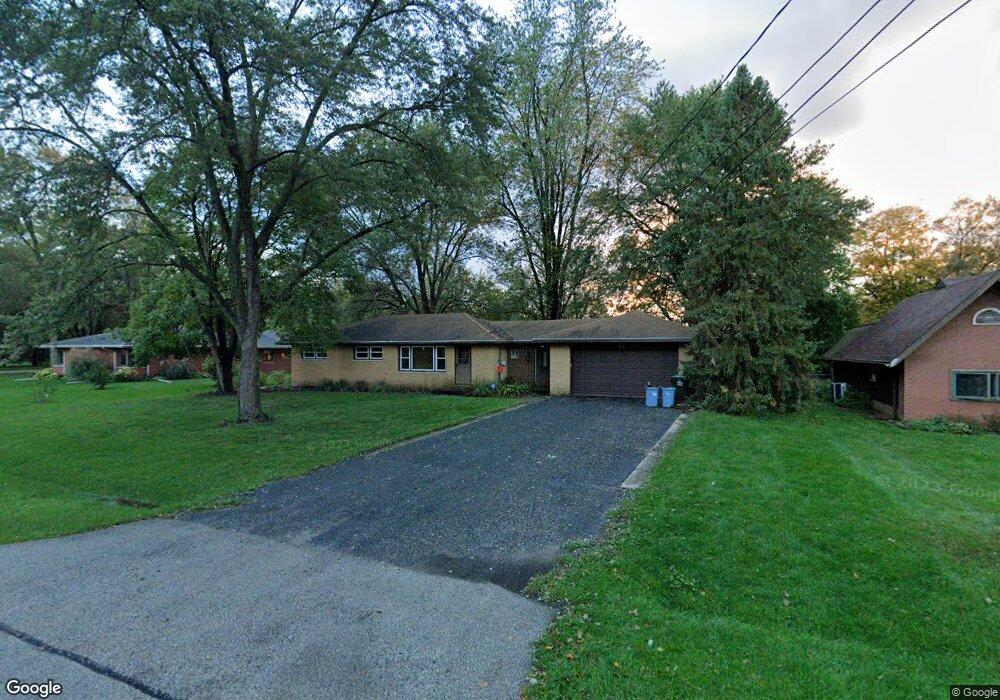
202 Waterman Ave Prospect Heights, IL 60070
Estimated Value: $422,000 - $433,000
3
Beds
1
Bath
1,255
Sq Ft
$339/Sq Ft
Est. Value
About This Home
This home is located at 202 Waterman Ave, Prospect Heights, IL 60070 and is currently estimated at $426,065, approximately $339 per square foot. 202 Waterman Ave is a home located in Cook County with nearby schools including Dwight D Eisenhower Elementary School, Anne Sullivan Elementary School, and Betsy Ross Elementary School.
Ownership History
Date
Name
Owned For
Owner Type
Purchase Details
Closed on
Nov 16, 2011
Sold by
Werner Eric R
Bought by
Werner Eric R and Werner Rosann
Current Estimated Value
Home Financials for this Owner
Home Financials are based on the most recent Mortgage that was taken out on this home.
Original Mortgage
$137,500
Outstanding Balance
$94,033
Interest Rate
4.08%
Mortgage Type
New Conventional
Estimated Equity
$332,032
Purchase Details
Closed on
Jun 9, 2000
Sold by
Werner Eric R and Werner Laura C
Bought by
Werner Eric R
Home Financials for this Owner
Home Financials are based on the most recent Mortgage that was taken out on this home.
Original Mortgage
$155,000
Interest Rate
8.64%
Purchase Details
Closed on
Feb 29, 1996
Sold by
Bonifacio Frank E and Bonifacio Michele E
Bought by
Werner Eric R and Werner Laura C
Home Financials for this Owner
Home Financials are based on the most recent Mortgage that was taken out on this home.
Original Mortgage
$155,600
Interest Rate
7.05%
Create a Home Valuation Report for This Property
The Home Valuation Report is an in-depth analysis detailing your home's value as well as a comparison with similar homes in the area
Home Values in the Area
Average Home Value in this Area
Purchase History
| Date | Buyer | Sale Price | Title Company |
|---|---|---|---|
| Werner Eric R | -- | Lsi | |
| Werner Eric R | -- | Stewart Title | |
| Werner Eric R | $194,500 | Intercounty Title |
Source: Public Records
Mortgage History
| Date | Status | Borrower | Loan Amount |
|---|---|---|---|
| Open | Werner Eric R | $137,500 | |
| Closed | Werner Eric R | $155,000 | |
| Closed | Werner Eric R | $155,600 |
Source: Public Records
Tax History Compared to Growth
Tax History
| Year | Tax Paid | Tax Assessment Tax Assessment Total Assessment is a certain percentage of the fair market value that is determined by local assessors to be the total taxable value of land and additions on the property. | Land | Improvement |
|---|---|---|---|---|
| 2024 | $8,017 | $29,991 | $14,991 | $15,000 |
| 2023 | $7,487 | $29,991 | $14,991 | $15,000 |
| 2022 | $7,487 | $29,991 | $14,991 | $15,000 |
| 2021 | $6,820 | $24,131 | $9,994 | $14,137 |
| 2020 | $6,677 | $24,131 | $9,994 | $14,137 |
| 2019 | $6,670 | $26,962 | $9,994 | $16,968 |
| 2018 | $6,624 | $24,863 | $8,494 | $16,369 |
| 2017 | $6,568 | $24,863 | $8,494 | $16,369 |
| 2016 | $6,364 | $24,863 | $8,494 | $16,369 |
| 2015 | $6,626 | $23,711 | $7,495 | $16,216 |
| 2014 | $6,573 | $23,711 | $7,495 | $16,216 |
| 2013 | $6,393 | $23,711 | $7,495 | $16,216 |
Source: Public Records
Map
Nearby Homes
- 2315 E Olive St Unit 3G
- 2315 E Olive St Unit 2G
- 1215 N Waterman Ave Unit 3L
- 2403 E Brandenberry Ct Unit 2A
- 2424 E Oakton St Unit 3C
- 2420 E Brandenberry Ct Unit 4C
- 2431 E Brandenberry Ct Unit 2O
- 2443 E Brandenberry Ct Unit 2A
- 2443 E Brandenberry Ct Unit 1B
- 2611 E Radford Ct
- 1101 N Stratford Rd
- 412 W Olive Ave
- 1510 N Kendal Ct Unit 11510
- 1511 N Windsor Dr Unit 208
- 1603 N Windsor Dr Unit 102
- 1605 E Frederick St
- 1633 N Windsor Dr Unit 113
- 1401 Plum Ct Unit D
- 1311 Nutmeg Ct Unit A
- 910 Persimmon Ln Unit A
- 200 Waterman Ave
- 204 Waterman Ave
- 203 Linden Rd S
- 206 Waterman Ave
- 205 Linden Rd S
- 201 Linden Rd S
- 201 N Waterman Ave
- 207 Linden Rd S
- 203 Waterman Ave
- 201 Waterman Ave
- 205 Waterman Ave
- 208 Waterman Ave
- 1228 Center Ln
- 207 Waterman Ave
- 1227 Center Ln
- 209 Linden Rd S
- 1226 Center Ln
- 202 Linden Rd S
- 210 Waterman Ave
- 209 Waterman Ave