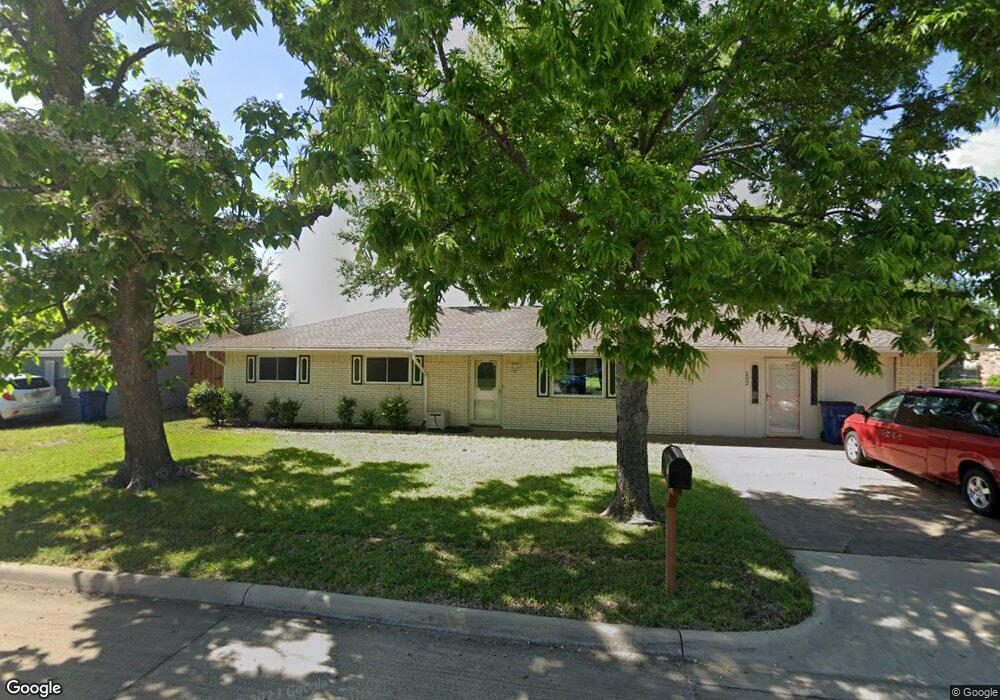
202 Wayne Dr Sanger, TX 76266
Estimated Value: $260,520 - $282,000
3
Beds
1
Bath
1,650
Sq Ft
$165/Sq Ft
Est. Value
About This Home
This home is located at 202 Wayne Dr, Sanger, TX 76266 and is currently estimated at $271,630, approximately $164 per square foot. 202 Wayne Dr is a home located in Denton County with nearby schools including Butterfield Elementary School, Clear Creek Intermediate School, and Sanger Sixth Grade Campus.
Ownership History
Date
Name
Owned For
Owner Type
Purchase Details
Closed on
May 2, 2016
Sold by
Grober Melanie G
Bought by
Cook Linda Linette and Grober Melanie G
Current Estimated Value
Home Financials for this Owner
Home Financials are based on the most recent Mortgage that was taken out on this home.
Original Mortgage
$34,500
Outstanding Balance
$14,917
Interest Rate
3.71%
Mortgage Type
Credit Line Revolving
Estimated Equity
$256,713
Purchase Details
Closed on
Feb 28, 2000
Sold by
Ciuba Robert F and Ciuba Nita V
Bought by
Grober Melanie G
Home Financials for this Owner
Home Financials are based on the most recent Mortgage that was taken out on this home.
Original Mortgage
$84,950
Outstanding Balance
$27,945
Interest Rate
8.31%
Mortgage Type
FHA
Estimated Equity
$243,685
Purchase Details
Closed on
Mar 15, 1996
Sold by
Howard James H and Howard Tinnie L
Bought by
Ciuba Robert F and Ciuba Nita
Home Financials for this Owner
Home Financials are based on the most recent Mortgage that was taken out on this home.
Original Mortgage
$55,575
Interest Rate
7.03%
Create a Home Valuation Report for This Property
The Home Valuation Report is an in-depth analysis detailing your home's value as well as a comparison with similar homes in the area
Home Values in the Area
Average Home Value in this Area
Purchase History
| Date | Buyer | Sale Price | Title Company |
|---|---|---|---|
| Cook Linda Linette | -- | None Available | |
| Grober Melanie G | -- | -- | |
| Ciuba Robert F | -- | -- |
Source: Public Records
Mortgage History
| Date | Status | Borrower | Loan Amount |
|---|---|---|---|
| Open | Cook Linda Linette | $34,500 | |
| Open | Grober Melanie G | $84,950 | |
| Previous Owner | Ciuba Robert F | $55,575 |
Source: Public Records
Tax History
| Year | Tax Paid | Tax Assessment Tax Assessment Total Assessment is a certain percentage of the fair market value that is determined by local assessors to be the total taxable value of land and additions on the property. | Land | Improvement |
|---|---|---|---|---|
| 2025 | $1,907 | $203,636 | $69,750 | $133,886 |
| 2024 | $1,907 | $219,616 | $69,750 | $149,866 |
| 2023 | $2,559 | $207,745 | $54,250 | $153,495 |
| 2022 | $4,494 | $202,641 | $46,750 | $168,720 |
| 2021 | $3,872 | $205,097 | $38,250 | $166,847 |
| 2020 | $3,706 | $167,472 | $38,250 | $129,222 |
| 2019 | $3,644 | $160,050 | $38,250 | $131,450 |
| 2018 | $3,330 | $145,500 | $38,250 | $112,948 |
| 2017 | $3,042 | $132,273 | $38,250 | $102,612 |
| 2016 | $2,766 | $120,248 | $21,250 | $98,998 |
| 2015 | $2,467 | $109,887 | $21,250 | $88,637 |
| 2013 | -- | $101,180 | $21,250 | $79,930 |
Source: Public Records
Map
Nearby Homes
Your Personal Tour Guide
Ask me questions while you tour the home.