Estimated Value: $68,173 - $115,000
--
Bed
1
Bath
864
Sq Ft
$109/Sq Ft
Est. Value
About This Home
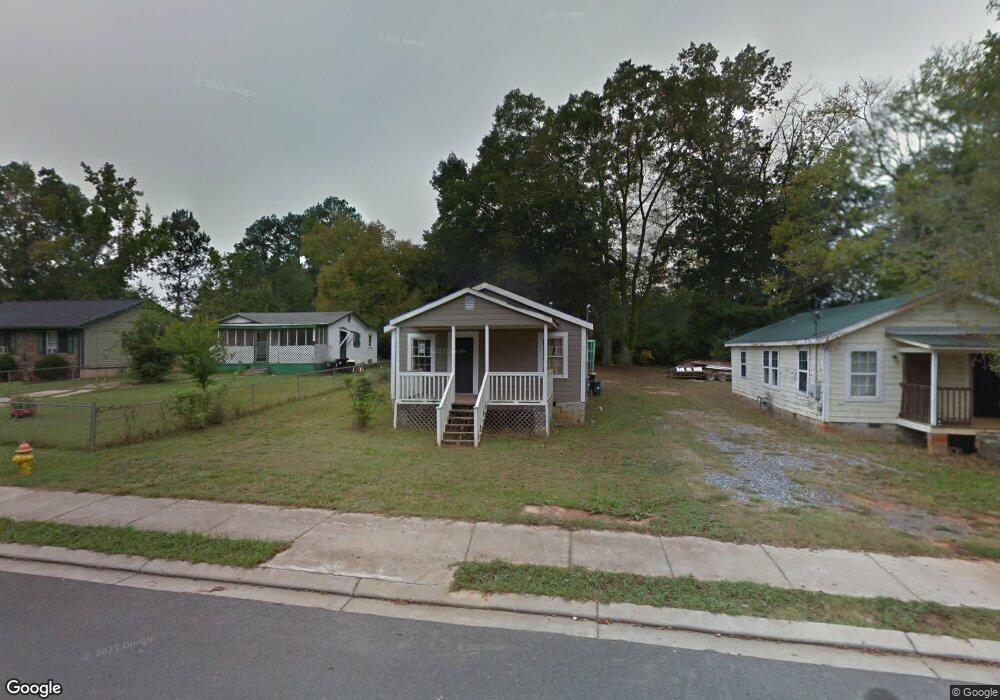
This home is located at 202 Wilson Ave SW, Rome, GA 30161 and is currently estimated at $94,293, approximately $109 per square foot. 202 Wilson Ave SW is a home located in Floyd County with nearby schools including Dan McCarty Middle School, Rome High School, and Darlington School.
Ownership History
Date
Name
Owned For
Owner Type
Purchase Details
Closed on
Dec 20, 2007
Sold by
Not Provided
Bought by
Significant Inc
Current Estimated Value
Purchase Details
Closed on
Dec 4, 2007
Sold by
Not Provided
Bought by
Significant Inc
Purchase Details
Closed on
Jun 17, 2003
Sold by
Armas Mario and Naguszewski Robert K
Bought by
N & A Properties Inc
Purchase Details
Closed on
Apr 1, 2003
Sold by
Cooper John S
Bought by
Armas Mario and Naguszewski Robert K
Purchase Details
Closed on
Nov 13, 1984
Sold by
Hamilton Horace
Bought by
Cooper John S
Purchase Details
Closed on
Feb 28, 1984
Sold by
Pine Log Land Co
Bought by
Hamilton Horace
Purchase Details
Closed on
Nov 1, 1983
Sold by
Clonts David and William Thorton
Bought by
Pine Log Land Co
Purchase Details
Closed on
Feb 3, 1983
Sold by
Pine Log Land Co
Bought by
Clonts David and William Thorton
Purchase Details
Closed on
Jan 28, 1983
Sold by
Chastine J H Jemima B
Bought by
Pine Log Land Co
Purchase Details
Closed on
Jan 1, 1901
Bought by
Chastine J H Jemima B
Create a Home Valuation Report for This Property
The Home Valuation Report is an in-depth analysis detailing your home's value as well as a comparison with similar homes in the area
Home Values in the Area
Average Home Value in this Area
Purchase History
| Date | Buyer | Sale Price | Title Company |
|---|---|---|---|
| Significant Inc | $7,055 | -- | |
| Significant Inc | $7,055 | -- | |
| Significant Inc | $20,000 | -- | |
| N & A Properties Inc | $15,800 | -- | |
| Armas Mario | $6,100 | -- | |
| Cooper John S | $14,500 | -- | |
| Hamilton Horace | -- | -- | |
| Pine Log Land Co | $100 | -- | |
| Clonts David | $600 | -- | |
| Pine Log Land Co | $11,800 | -- | |
| Chastine J H Jemima B | -- | -- |
Source: Public Records
Tax History Compared to Growth
Tax History
| Year | Tax Paid | Tax Assessment Tax Assessment Total Assessment is a certain percentage of the fair market value that is determined by local assessors to be the total taxable value of land and additions on the property. | Land | Improvement |
|---|---|---|---|---|
| 2024 | $581 | $14,880 | $4,356 | $10,524 |
| 2023 | $527 | $14,028 | $3,960 | $10,068 |
| 2022 | $416 | $11,388 | $3,168 | $8,220 |
| 2021 | $326 | $8,786 | $3,168 | $5,618 |
| 2020 | $290 | $7,742 | $2,475 | $5,267 |
| 2019 | $273 | $7,381 | $2,475 | $4,906 |
| 2018 | $250 | $6,762 | $2,475 | $4,287 |
| 2017 | $243 | $6,550 | $2,475 | $4,075 |
| 2016 | $291 | $7,840 | $2,440 | $5,400 |
| 2015 | -- | $7,840 | $2,440 | $5,400 |
| 2014 | -- | $3,440 | $2,440 | $1,000 |
Source: Public Records
Map
Nearby Homes
- 218 Wilson Ave SW
- 101 Hardy Ave SW
- 334 Branham Ave SW
- 410 Hardy Ave SW
- 204 Myrtle St SW
- 110 Cherokee St SW
- 3 Grover St SW
- 105 Mary St SW
- 107 Butler St SW
- 3 Porter St SW
- 18 Butler St SW
- 232 S Broad St SW
- 515 Harper Ave SW
- 529 Branham Ave SW
- 515 S Broad St SW
- 115 Lookout Cir SW
- 113 Lookout Cir SW
- 111 Lookout Cir SW
- 6 Horseleg Creek Rd SW
- 204 Wilson Ave SW
- 200 Wilson Ave SW
- 206 Wilson Ave SW Unit 218
- 206 Wilson Ave SW
- 116 Wilson Ave SW
- 201 Wilson Ave SW
- 114 Wilson Ave SW
- 210 Wilson Ave SW
- 207 Wilson Ave SW
- 106 Charles St SW
- 112 Wilson Ave SW
- 101 Charles St SW
- 0 Wilson Ave Unit 168 7528936
- 0 Wilson Ave Unit 20133403
- 0 Wilson Ave Unit 20095961
- 0 Wilson Ave Unit 8984637
- 0 Wilson Ave Unit 9038587
- 212 Wilson Ave SW
- 212 Wilson Ave SW
- 104 Charles St SW