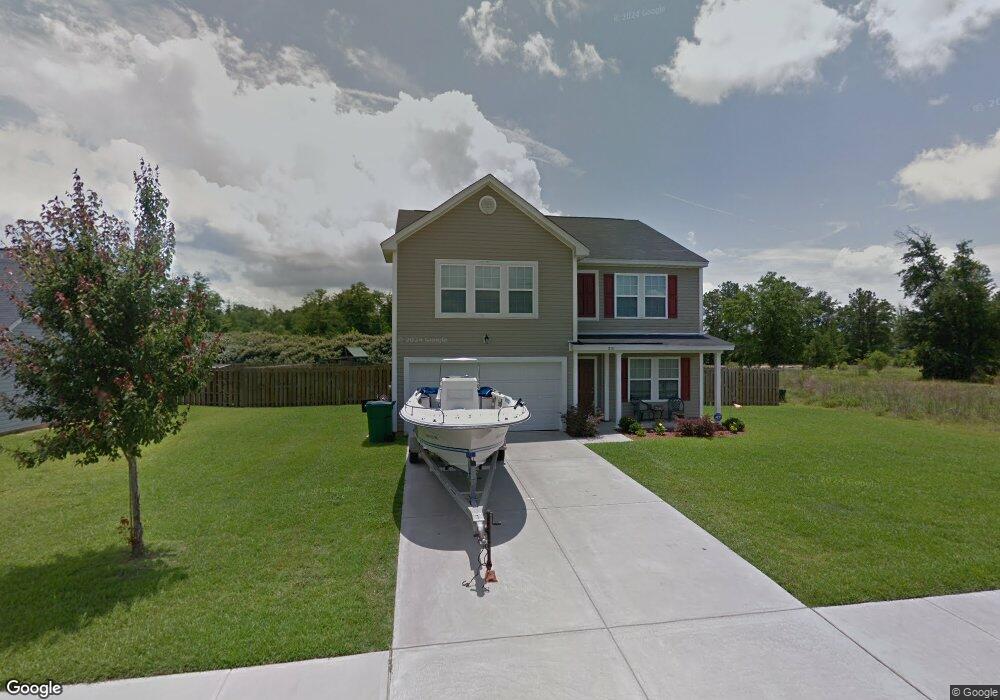
202 Windsong Dr Unit 85 Rincon, GA 31326
Estimated Value: $324,765 - $354,000
3
Beds
3
Baths
2,426
Sq Ft
$137/Sq Ft
Est. Value
About This Home
This home is located at 202 Windsong Dr Unit 85, Rincon, GA 31326 and is currently estimated at $333,441, approximately $137 per square foot. 202 Windsong Dr Unit 85 is a home located in Effingham County with nearby schools including Rincon Elementary School, Ebenezer Middle School, and Effingham County High School.
Ownership History
Date
Name
Owned For
Owner Type
Purchase Details
Closed on
Mar 13, 2020
Sold by
Beaucelie Lisa
Bought by
Mosier Ryan and Mosier Colleen
Current Estimated Value
Home Financials for this Owner
Home Financials are based on the most recent Mortgage that was taken out on this home.
Original Mortgage
$204,497
Outstanding Balance
$179,975
Interest Rate
3.4%
Mortgage Type
VA
Estimated Equity
$153,466
Purchase Details
Closed on
Nov 18, 2019
Sold by
Beaucelie Lisa
Bought by
Beaucelie Lisa and Gillilan Dru
Purchase Details
Closed on
Apr 19, 2019
Sold by
Pennymac Loan Svcs Llc
Bought by
C L Greer Enterprises Inc
Purchase Details
Closed on
Feb 25, 2019
Sold by
Kicklighter David N
Bought by
Pennymac Loan Svcs Llc
Purchase Details
Closed on
Jan 27, 2009
Sold by
Fred Williams Homebuilders Inc
Bought by
Kicklighter David N and Kicklighter Ashlie M
Home Financials for this Owner
Home Financials are based on the most recent Mortgage that was taken out on this home.
Original Mortgage
$187,248
Interest Rate
5.08%
Mortgage Type
FHA
Create a Home Valuation Report for This Property
The Home Valuation Report is an in-depth analysis detailing your home's value as well as a comparison with similar homes in the area
Home Values in the Area
Average Home Value in this Area
Purchase History
| Date | Buyer | Sale Price | Title Company |
|---|---|---|---|
| Mosier Ryan | $199,900 | -- | |
| Beaucelie Lisa | -- | -- | |
| Beaucelie Lisa | $194,000 | -- | |
| C L Greer Enterprises Inc | $138,600 | -- | |
| Pennymac Loan Svcs Llc | -- | -- | |
| Kicklighter David N | $189,720 | -- |
Source: Public Records
Mortgage History
| Date | Status | Borrower | Loan Amount |
|---|---|---|---|
| Open | Mosier Ryan | $204,497 | |
| Previous Owner | Kicklighter David N | $187,248 |
Source: Public Records
Tax History Compared to Growth
Tax History
| Year | Tax Paid | Tax Assessment Tax Assessment Total Assessment is a certain percentage of the fair market value that is determined by local assessors to be the total taxable value of land and additions on the property. | Land | Improvement |
|---|---|---|---|---|
| 2025 | $3,387 | $123,039 | $22,800 | $100,239 |
| 2024 | $3,387 | $105,459 | $22,800 | $82,659 |
| 2023 | $2,867 | $117,603 | $17,600 | $100,003 |
| 2022 | $2,313 | $87,850 | $17,600 | $70,250 |
| 2021 | $2,139 | $83,316 | $14,000 | $69,316 |
| 2020 | $2,259 | $82,062 | $12,000 | $70,062 |
| 2019 | $2,336 | $81,524 | $10,000 | $71,524 |
| 2018 | $2,331 | $83,411 | $10,000 | $73,411 |
| 2017 | $2,357 | $83,069 | $10,000 | $73,069 |
| 2016 | $2,019 | $70,499 | $5,600 | $64,899 |
| 2015 | -- | $76,899 | $12,000 | $64,899 |
| 2014 | -- | $76,899 | $12,000 | $64,899 |
| 2013 | -- | $68,739 | $3,840 | $64,899 |
Source: Public Records
Map
Nearby Homes
- 518 Westminster Ct
- 601 Heathcliff Ct
- 415 Seabreeze Dr
- 216 Market St
- 427 Seabreeze Dr
- 124 Tolliver Ln
- 148 Sweetwater Cir
- 156 Stonewalk Dr
- 233 Jasper Ln
- 419 Flint Dr
- 221 Jasper Ln
- 267 Jasper Ln
- 235 Saint Andrews Rd
- 114 Reese Way
- 136 Fraser Ln
- 107 Stonewalk Dr
- 317 St Andrews Rd
- 114 Stonewalk Dr
- 417 Keiffer Dr
- LOT 2 Grove Hollow Rd
- 202 Windsong Dr
- 192 Windsong Dr
- 204 Windsong Dr
- 206 Windsong Dr
- 217 Windsong Dr
- 219 Windsong Dr Unit 78
- 219 Windsong Dr
- 102 Tolliver Ln
- 208 Windsong Dr
- 312 Windmill Dr
- 312 Windmill Dr
- 104 Tolliver Ln
- 304 Windmill Dr
- 314 Windmill Dr
- 211 Windsong Dr
- 205 Windsong Dr
- 106 Tolliver Ln
- 100 Tolliver Ln
- 316 Windmill Dr
- 221 Windsong Dr