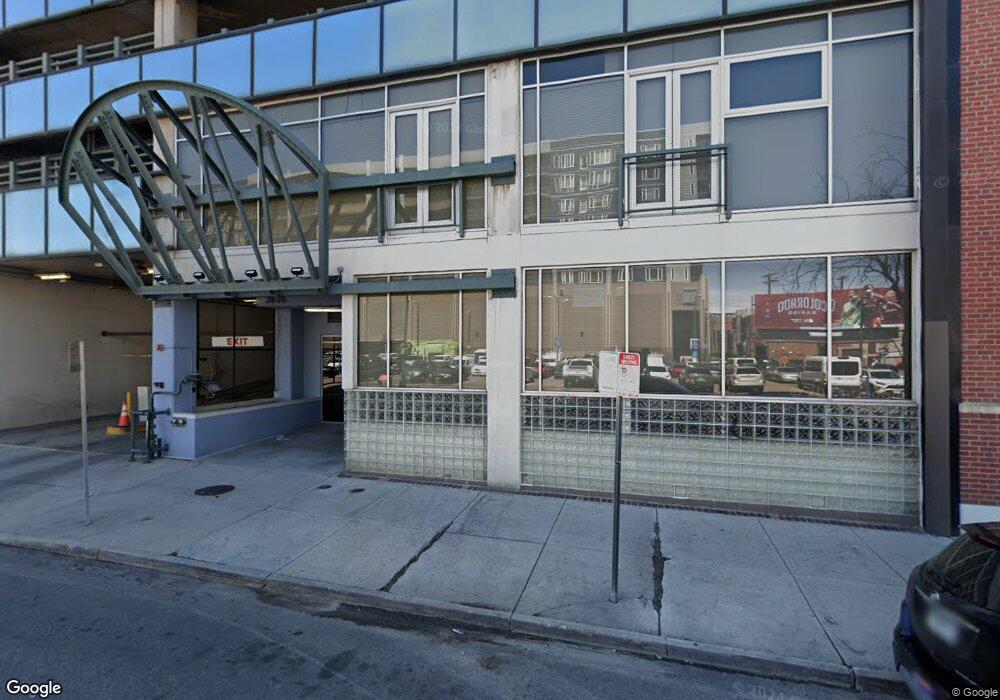
2020 Arapahoe St Unit 1030 Denver, CO 80205
Five Points NeighborhoodEstimated Value: $429,000 - $475,000
1
Bed
2
Baths
1,171
Sq Ft
$389/Sq Ft
Est. Value
About This Home
This home is located at 2020 Arapahoe St Unit 1030, Denver, CO 80205 and is currently estimated at $455,907, approximately $389 per square foot. 2020 Arapahoe St Unit 1030 is a home located in Denver County with nearby schools including Whittier ECE-8 School, Cole Arts & Science Academy, and McAuliffe Manual Middle School.
Ownership History
Date
Name
Owned For
Owner Type
Purchase Details
Closed on
May 23, 2003
Sold by
Proper Kenneth W and Proper Joann L
Bought by
Nelson Ronald
Current Estimated Value
Home Financials for this Owner
Home Financials are based on the most recent Mortgage that was taken out on this home.
Original Mortgage
$270,275
Outstanding Balance
$97,806
Interest Rate
3.5%
Mortgage Type
Purchase Money Mortgage
Estimated Equity
$358,101
Purchase Details
Closed on
May 28, 1996
Sold by
Arapahoe Street Lofts Llc
Bought by
Proper Kenneth W and Proper Joann L
Home Financials for this Owner
Home Financials are based on the most recent Mortgage that was taken out on this home.
Original Mortgage
$223,250
Interest Rate
7.62%
Create a Home Valuation Report for This Property
The Home Valuation Report is an in-depth analysis detailing your home's value as well as a comparison with similar homes in the area
Home Values in the Area
Average Home Value in this Area
Purchase History
| Date | Buyer | Sale Price | Title Company |
|---|---|---|---|
| Nelson Ronald | $284,500 | First American Heritage Titl | |
| Proper Kenneth W | $235,000 | -- |
Source: Public Records
Mortgage History
| Date | Status | Borrower | Loan Amount |
|---|---|---|---|
| Open | Nelson Ronald | $270,275 | |
| Previous Owner | Proper Kenneth W | $223,250 |
Source: Public Records
Tax History Compared to Growth
Tax History
| Year | Tax Paid | Tax Assessment Tax Assessment Total Assessment is a certain percentage of the fair market value that is determined by local assessors to be the total taxable value of land and additions on the property. | Land | Improvement |
|---|---|---|---|---|
| 2024 | $2,577 | $32,540 | $630 | $31,910 |
| 2023 | $2,521 | $32,540 | $630 | $31,910 |
| 2022 | $2,603 | $32,730 | $4,480 | $28,250 |
| 2021 | $2,512 | $33,660 | $4,600 | $29,060 |
| 2020 | $2,242 | $30,220 | $2,560 | $27,660 |
| 2019 | $2,179 | $30,220 | $2,560 | $27,660 |
| 2018 | $2,285 | $29,540 | $2,270 | $27,270 |
| 2017 | $2,279 | $29,540 | $2,270 | $27,270 |
| 2016 | $2,125 | $26,060 | $2,507 | $23,553 |
| 2015 | $2,036 | $26,060 | $2,507 | $23,553 |
| 2014 | $1,985 | $23,900 | $1,250 | $22,650 |
Source: Public Records
Map
Nearby Homes
- 2020 Arapahoe St Unit P37
- 2020 Arapahoe St Unit 950
- 2020 Arapahoe St Unit 1130
- 2020 Arapahoe St Unit 970
- 2020 Arapahoe St Unit 1150
- 2020 Arapahoe St Unit 860
- 2000 Arapahoe St Unit 503
- 2000 Arapahoe St Unit 1
- 1891 Curtis St Unit 1607
- 3044 Champa St Unit 9 and NE 2/10
- 2101 Larimer St Unit 302
- 1800 Lawrence St Unit 408
- 2256 Curtis St
- 1940 Blake St Unit 301
- 1940 Blake St Unit 300
- 1940 Blake St Unit 302
- 1777 Larimer St Unit 1502
- 1777 Larimer St Unit 2108
- 1777 Larimer St Unit 902
- 1777 Larimer St Unit 1610
- 2020 Arapahoe St Unit LL
- 2020 Arapahoe St Unit 1270
- 2020 Arapahoe St Unit 1260
- 2020 Arapahoe St Unit 1250
- 2020 Arapahoe St Unit 1240
- 2020 Arapahoe St Unit 1230
- 2020 Arapahoe St
- 2020 Arapahoe St Unit 1210
- 2020 Arapahoe St Unit 1170
- 2020 Arapahoe St Unit 1160
- 2020 Arapahoe St
- 2020 Arapahoe St Unit 1140
- 2020 Arapahoe St Unit 1120
- 2020 Arapahoe St Unit 1110
- 2020 Arapahoe St Unit 1070
- 2020 Arapahoe St Unit 1060
- 2020 Arapahoe St Unit 1050
- 2020 Arapahoe St Unit 1040
- 2020 Arapahoe St Unit 1020
- 2020 Arapahoe St