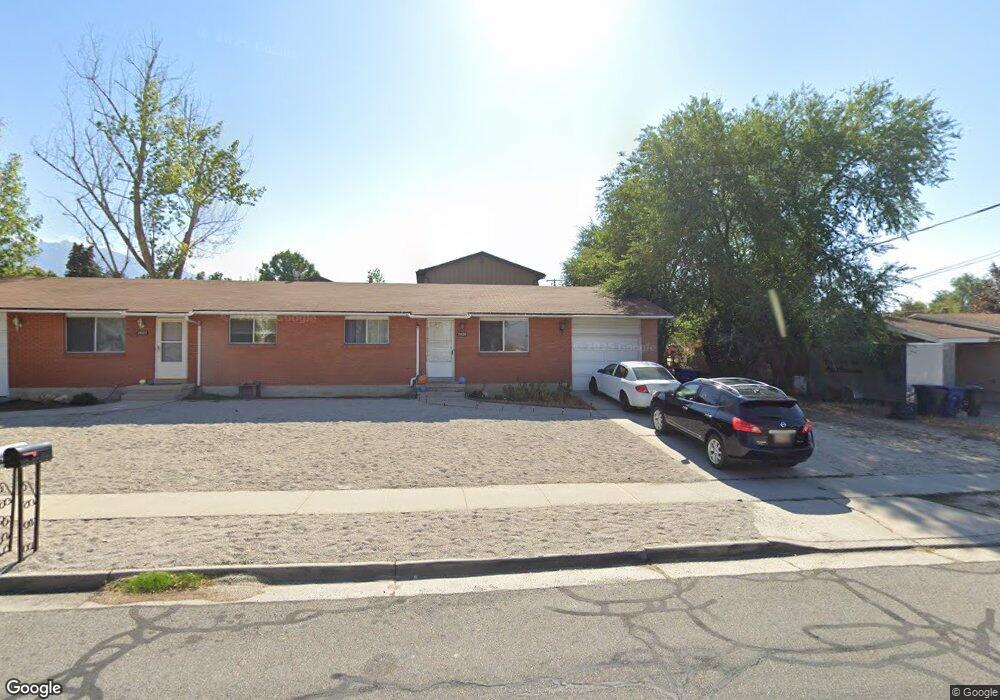
2020 E 7205 S Unit 2022 Salt Lake City, UT 84121
Estimated Value: $651,721 - $707,000
4
Beds
2
Baths
1,508
Sq Ft
$453/Sq Ft
Est. Value
About This Home
This home is located at 2020 E 7205 S Unit 2022, Salt Lake City, UT 84121 and is currently estimated at $682,430, approximately $452 per square foot. 2020 E 7205 S Unit 2022 is a home located in Salt Lake County with nearby schools including Bella Vista School, Butler Middle School, and Brighton High School.
Ownership History
Date
Name
Owned For
Owner Type
Purchase Details
Closed on
May 9, 2019
Sold by
Warnock Williams Linda Wasden
Bought by
Linda W Warnock Llc
Current Estimated Value
Purchase Details
Closed on
Apr 10, 2019
Sold by
Warnock Warnock Linda Wasden Williams Linda Wasden Williams
Bought by
Linda W Warnock Llc
Purchase Details
Closed on
Nov 30, 2015
Sold by
Warnock Linda W W
Bought by
Warnock Linda Wasden William and The Linda Wasden Williams Warnock Living
Purchase Details
Closed on
Nov 3, 2015
Sold by
Warnock Linda W W
Bought by
Warncok Williams Warnock Linda Wasden and Linda Wasden Williams Warncok Living Tru
Purchase Details
Closed on
Apr 20, 2012
Sold by
Linda W Warnock L L C
Bought by
Warnock Linda Wasden Williams and Warnock Trust
Purchase Details
Closed on
Sep 1, 2005
Sold by
Wasden Wayne W
Bought by
Williams Linda Wasden
Create a Home Valuation Report for This Property
The Home Valuation Report is an in-depth analysis detailing your home's value as well as a comparison with similar homes in the area
Home Values in the Area
Average Home Value in this Area
Purchase History
| Date | Buyer | Sale Price | Title Company |
|---|---|---|---|
| Linda W Warnock Llc | -- | None Available | |
| Linda W Warnock Llc | -- | None Available | |
| Warnock Linda Wasden William | -- | None Available | |
| Warncok Williams Warnock Linda Wasden | -- | None Available | |
| Warnock Linda Wasden Williams | -- | None Available | |
| Williams Linda Wasden | -- | -- |
Source: Public Records
Tax History Compared to Growth
Tax History
| Year | Tax Paid | Tax Assessment Tax Assessment Total Assessment is a certain percentage of the fair market value that is determined by local assessors to be the total taxable value of land and additions on the property. | Land | Improvement |
|---|---|---|---|---|
| 2025 | $3,913 | $728,300 | $241,300 | $487,000 |
| 2024 | $3,913 | $697,800 | $232,200 | $465,600 |
| 2023 | $3,723 | $645,600 | $223,300 | $422,300 |
| 2022 | $3,508 | $600,300 | $218,900 | $381,400 |
| 2021 | $3,447 | $490,800 | $167,400 | $323,400 |
| 2020 | $3,090 | $413,500 | $167,400 | $246,100 |
| 2019 | $3,130 | $406,800 | $157,900 | $248,900 |
| 2018 | $2,938 | $396,900 | $157,900 | $239,000 |
| 2017 | $2,749 | $360,300 | $157,900 | $202,400 |
| 2016 | $2,582 | $328,200 | $142,300 | $185,900 |
| 2015 | $2,458 | $289,500 | $157,900 | $131,600 |
| 2014 | $2,412 | $276,200 | $153,700 | $122,500 |
Source: Public Records
Map
Nearby Homes
- 7265 S 1950 E Unit 14
- 7265 S 1950 E Unit 18
- 2099 Worchester Dr
- 1938 E 7130 S
- 1920 E 7130 S
- 1895 E 7160 S
- 7187 Villandrie Ln
- 7195 S Villandrie Ln
- 2134 Somerset Dr
- 7094 S Cadens Cove
- 2110 Lonsdale Dr
- 2057 E Castle Hill Ave
- 7034 S Cadens Cove
- 2129 E Villaire Ave
- 2249 Tompkins Dr
- 2262 E Emerald Hills Ct Unit 8
- 2268 E 7160 S
- 7138 S Chris Ln
- 2063 E Kane Cir
- 2288 E Emerald Hills Ct Unit 2
- 7222 Ponderosa Dr Unit 7224
- 2027 E 7205 S
- 2004 E 7205 S Unit 2006
- 2029 E 7205 S
- 2017 E 7205 S
- 7238 Ponderosa Dr
- 2031 E 7205 S
- 7187 S Highland Dr
- 7215 Highland Dr Unit 7217
- 7215 S Highland Dr
- 2013 E 7205 S
- 2033 E 7205 S
- 7240 Ponderosa Dr
- 7219 Ponderosa Dr
- 7225 Highland Dr Unit 7227
- 7225 S Highland Dr
- 7182 S Ponderosa Dr
- 7240 S Ponderosa Dr
- 7177 S Highland Dr
- 7182 Ponderosa Dr