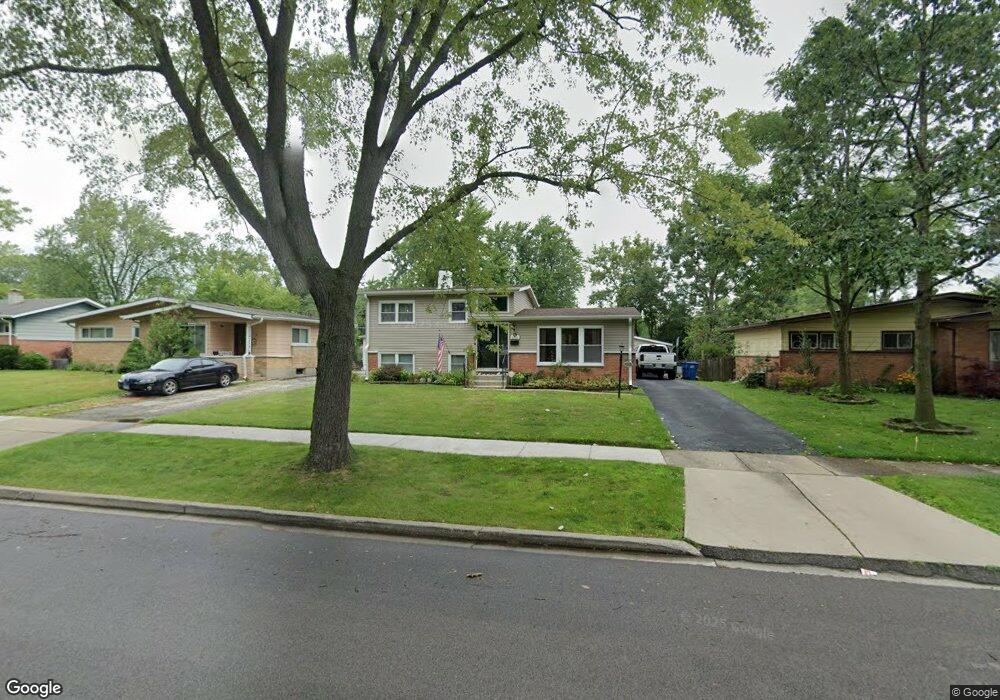
2020 Edgewood Rd Waukegan, IL 60087
Estimated Value: $250,000 - $313,000
3
Beds
2
Baths
1,008
Sq Ft
$266/Sq Ft
Est. Value
About This Home
This home is located at 2020 Edgewood Rd, Waukegan, IL 60087 and is currently estimated at $268,298, approximately $266 per square foot. 2020 Edgewood Rd is a home located in Lake County with nearby schools including H R McCall Elementary School, Jack Benny Middle School, and Waukegan High School.
Ownership History
Date
Name
Owned For
Owner Type
Purchase Details
Closed on
Mar 16, 2010
Sold by
Cocom William H
Bought by
Ruiz Megghan R
Current Estimated Value
Home Financials for this Owner
Home Financials are based on the most recent Mortgage that was taken out on this home.
Original Mortgage
$103,098
Outstanding Balance
$69,384
Interest Rate
5.37%
Mortgage Type
FHA
Estimated Equity
$198,914
Purchase Details
Closed on
Nov 21, 2003
Sold by
Garrison David W and Estate Of Verle D Garrison
Bought by
Cocom William H
Home Financials for this Owner
Home Financials are based on the most recent Mortgage that was taken out on this home.
Original Mortgage
$111,120
Interest Rate
7.76%
Mortgage Type
Purchase Money Mortgage
Create a Home Valuation Report for This Property
The Home Valuation Report is an in-depth analysis detailing your home's value as well as a comparison with similar homes in the area
Home Values in the Area
Average Home Value in this Area
Purchase History
| Date | Buyer | Sale Price | Title Company |
|---|---|---|---|
| Ruiz Megghan R | $105,000 | Affinity Title Services Llc | |
| Cocom William H | $139,000 | -- |
Source: Public Records
Mortgage History
| Date | Status | Borrower | Loan Amount |
|---|---|---|---|
| Open | Ruiz Megghan R | $103,098 | |
| Previous Owner | Cocom William H | $111,120 | |
| Closed | Cocom William H | $27,780 |
Source: Public Records
Tax History Compared to Growth
Tax History
| Year | Tax Paid | Tax Assessment Tax Assessment Total Assessment is a certain percentage of the fair market value that is determined by local assessors to be the total taxable value of land and additions on the property. | Land | Improvement |
|---|---|---|---|---|
| 2024 | $4,696 | $60,469 | $5,891 | $54,578 |
| 2023 | $4,735 | $58,374 | $5,687 | $52,687 |
| 2022 | $4,735 | $55,022 | $5,557 | $49,465 |
| 2021 | $4,041 | $45,256 | $5,416 | $39,840 |
| 2020 | $4,157 | $43,187 | $5,168 | $38,019 |
| 2019 | $4,305 | $40,974 | $4,903 | $36,071 |
| 2018 | $3,772 | $34,937 | $5,844 | $29,093 |
| 2017 | $3,760 | $32,867 | $5,498 | $27,369 |
| 2016 | $3,839 | $31,290 | $5,234 | $26,056 |
| 2015 | $3,762 | $28,696 | $4,800 | $23,896 |
| 2014 | $4,978 | $37,079 | $9,134 | $27,945 |
| 2012 | $5,751 | $38,532 | $9,492 | $29,040 |
Source: Public Records
Map
Nearby Homes
- 3211 Rugby Ct
- 3411 N Lewis Ave
- 37966 N Cornell Rd
- 3101 Country Club Ln
- 1730 W Beach Rd
- 1636 Rice St
- 38683 N Lewis Ave
- 38127 N Shore Ave
- 38362 N Manor Ave
- 2625 Vercoe Ave
- 37905 N Loyola Ave
- 1612 Whitney St
- 38697 N Cedar Ave
- 2613 N Lewis Ave
- 11345 W Carnahan Ave
- 12582 W Beach Rd
- 12312 W Audrey Ave
- 11342-11364 W Wadsworth Rd
- 2708 Dana Ave
- 2350 N Lewis Ave
- 2016 Edgewood Rd
- 2024 Edgewood Rd
- 2012 Edgewood Rd
- 2028 Edgewood Rd
- 2025 Herbert Dr
- 2021 Herbert Dr Unit 1
- 2017 Herbert Dr
- 2029 Herbert Dr
- 2008 Edgewood Rd
- 2032 Edgewood Rd
- 2021 Edgewood Rd
- 2013 Herbert Dr
- 2033 Herbert Dr
- 2017 Edgewood Rd
- 2025 Edgewood Rd
- 2013 Edgewood Rd Unit 1
- 2004 Edgewood Rd
- 2036 Edgewood Rd
- 2009 Herbert Dr
- 3415 Newcastle Rd