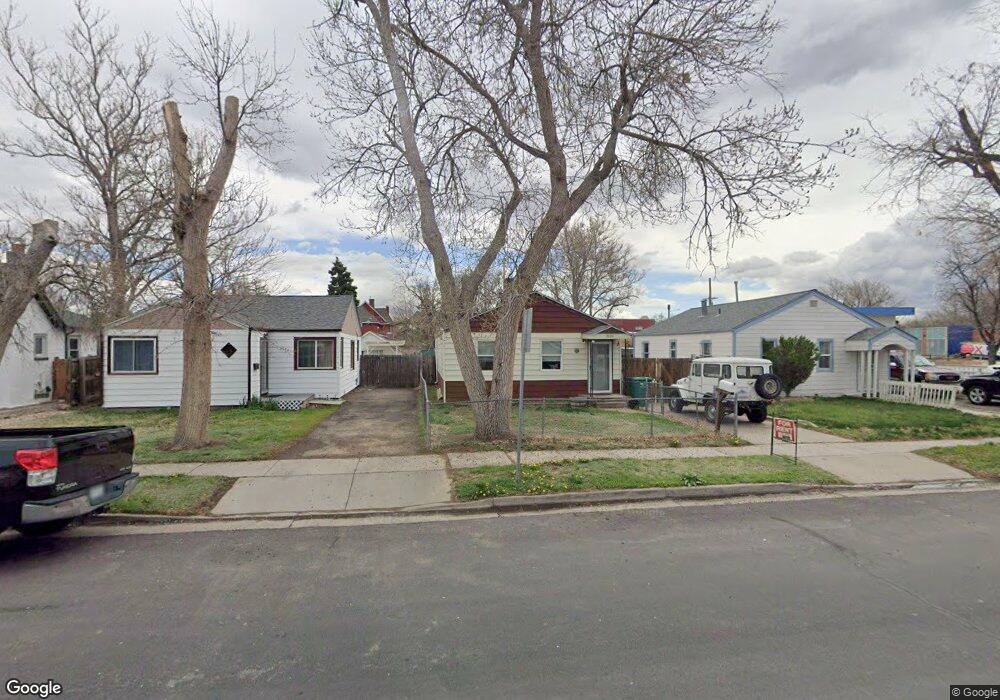
2020 Fulton St Aurora, CO 80010
North Aurora NeighborhoodEstimated Value: $305,000 - $386,000
2
Beds
1
Bath
716
Sq Ft
$470/Sq Ft
Est. Value
About This Home
This home is located at 2020 Fulton St, Aurora, CO 80010 and is currently estimated at $336,521, approximately $470 per square foot. 2020 Fulton St is a home located in Adams County with nearby schools including Lincoln Elementary School, North Middle School Health Sciences & Technology, and El Camino High School.
Ownership History
Date
Name
Owned For
Owner Type
Purchase Details
Closed on
Jan 10, 2025
Sold by
Braum John Howard
Bought by
John Howard Braum Family Trust and Braum
Current Estimated Value
Purchase Details
Closed on
Jun 2, 2006
Sold by
Hud
Bought by
Braum John H
Purchase Details
Closed on
Nov 4, 2005
Sold by
National City Mortgage Inc
Bought by
Hud
Purchase Details
Closed on
Nov 2, 2005
Sold by
Lopez Antonio
Bought by
National City Mortgage Inc
Purchase Details
Closed on
May 19, 2004
Sold by
Reely Linda G
Bought by
Lopez Antonio
Home Financials for this Owner
Home Financials are based on the most recent Mortgage that was taken out on this home.
Original Mortgage
$126,117
Interest Rate
6.12%
Mortgage Type
FHA
Purchase Details
Closed on
Dec 23, 1992
Create a Home Valuation Report for This Property
The Home Valuation Report is an in-depth analysis detailing your home's value as well as a comparison with similar homes in the area
Home Values in the Area
Average Home Value in this Area
Purchase History
| Date | Buyer | Sale Price | Title Company |
|---|---|---|---|
| John Howard Braum Family Trust | -- | None Listed On Document | |
| Braum John H | -- | None Available | |
| Hud | -- | -- | |
| National City Mortgage Inc | -- | -- | |
| Lopez Antonio | $127,900 | Fahtco | |
| -- | -- | -- |
Source: Public Records
Mortgage History
| Date | Status | Borrower | Loan Amount |
|---|---|---|---|
| Previous Owner | Lopez Antonio | $126,117 |
Source: Public Records
Tax History Compared to Growth
Tax History
| Year | Tax Paid | Tax Assessment Tax Assessment Total Assessment is a certain percentage of the fair market value that is determined by local assessors to be the total taxable value of land and additions on the property. | Land | Improvement |
|---|---|---|---|---|
| 2024 | $1,986 | $19,060 | $5,000 | $14,060 |
| 2023 | $2,018 | $22,660 | $5,210 | $17,450 |
| 2022 | $2,210 | $19,450 | $5,350 | $14,100 |
| 2021 | $2,304 | $19,450 | $5,350 | $14,100 |
| 2020 | $2,063 | $17,480 | $5,510 | $11,970 |
| 2019 | $2,059 | $17,480 | $5,510 | $11,970 |
| 2018 | $1,299 | $10,980 | $4,320 | $6,660 |
| 2017 | $1,154 | $10,980 | $4,320 | $6,660 |
| 2016 | $863 | $8,140 | $2,390 | $5,750 |
| 2015 | $836 | $8,140 | $2,390 | $5,750 |
| 2014 | $707 | $6,780 | $1,910 | $4,870 |
Source: Public Records
Map
Nearby Homes
- 2060 Fulton St
- 2000 Elmira St
- 2086 Elmira St
- 2226 Fulton St
- 2097 Hanover St
- 1956 Elmira St
- 2285 Fulton St
- 2080 Emporia St
- 2086 Hanover St
- 2332 Galena St
- 2028 Havana St
- 1746 Galena St
- 2356 Elmira St
- 2348 Emporia St
- 2356 Emporia St
- 2241 Ironton St
- 2064 Ironton St
- 10159 E 25th Dr
- 1620 Galena St
- 1940 Chester St
- 2030 Fulton St
- 2010 Fulton St
- 2036 Fulton St
- 2042 Fulton St
- 2027 Galena St
- 2035 Galena St
- 2017 Fulton St
- 2021 Fulton St
- 2045 Galena St
- 2037 Fulton St
- 2001 Fulton St
- 2053 Galena St
- 2059 Fulton St
- 2061 Galena St
- 2072 Fulton St
- 10100 E Montview Blvd
- 2065 Fulton St
- 2065 Galena St
- 2024 Galena St
- 2026 Galena St