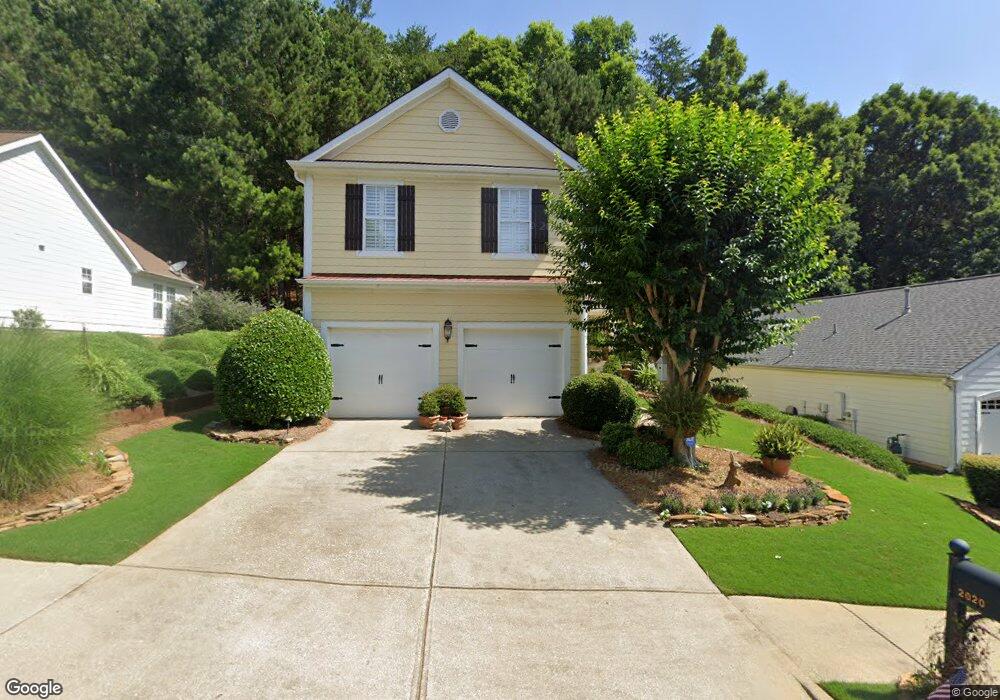
2020 Greenhill Pass Unit 2B Canton, GA 30114
Sutallee NeighborhoodEstimated Value: $386,726 - $408,000
3
Beds
3
Baths
1,656
Sq Ft
$240/Sq Ft
Est. Value
About This Home
This home is located at 2020 Greenhill Pass Unit 2B, Canton, GA 30114 and is currently estimated at $397,363, approximately $239 per square foot. 2020 Greenhill Pass Unit 2B is a home located in Cherokee County with nearby schools including Sixes Elementary School, Freedom Middle School, and Woodstock High School.
Ownership History
Date
Name
Owned For
Owner Type
Purchase Details
Closed on
May 12, 2006
Sold by
Savalas Julie Living Trust
Bought by
Treadaway Beverly
Current Estimated Value
Home Financials for this Owner
Home Financials are based on the most recent Mortgage that was taken out on this home.
Original Mortgage
$166,000
Outstanding Balance
$97,649
Interest Rate
6.87%
Mortgage Type
New Conventional
Estimated Equity
$299,714
Purchase Details
Closed on
Aug 16, 2004
Sold by
South Richard W
Bought by
Savalas Julie A
Purchase Details
Closed on
Apr 4, 2000
Sold by
Mckenzie-Perry Homes Inc
Bought by
South Richard W
Home Financials for this Owner
Home Financials are based on the most recent Mortgage that was taken out on this home.
Original Mortgage
$158,289
Interest Rate
8.34%
Mortgage Type
FHA
Create a Home Valuation Report for This Property
The Home Valuation Report is an in-depth analysis detailing your home's value as well as a comparison with similar homes in the area
Home Values in the Area
Average Home Value in this Area
Purchase History
| Date | Buyer | Sale Price | Title Company |
|---|---|---|---|
| Treadaway Beverly | $166,000 | -- | |
| Savalas Julie A | $240,000 | -- | |
| South Richard W | $159,600 | -- |
Source: Public Records
Mortgage History
| Date | Status | Borrower | Loan Amount |
|---|---|---|---|
| Open | Treadaway Beverly | $166,000 | |
| Previous Owner | South Richard W | $158,289 |
Source: Public Records
Tax History Compared to Growth
Tax History
| Year | Tax Paid | Tax Assessment Tax Assessment Total Assessment is a certain percentage of the fair market value that is determined by local assessors to be the total taxable value of land and additions on the property. | Land | Improvement |
|---|---|---|---|---|
| 2025 | $822 | $161,100 | $30,000 | $131,100 |
| 2024 | $796 | $157,000 | $30,000 | $127,000 |
| 2023 | $641 | $151,536 | $30,000 | $121,536 |
| 2022 | $705 | $116,836 | $24,000 | $92,836 |
| 2021 | $697 | $98,856 | $20,000 | $78,856 |
| 2020 | $686 | $95,316 | $20,000 | $75,316 |
| 2019 | $642 | $83,440 | $17,600 | $65,840 |
| 2018 | $627 | $76,600 | $16,400 | $60,200 |
| 2017 | $1,984 | $179,600 | $14,800 | $57,040 |
| 2016 | $1,861 | $165,600 | $13,600 | $52,640 |
| 2015 | $1,812 | $159,800 | $13,600 | $50,320 |
| 2014 | $1,721 | $151,800 | $12,000 | $48,720 |
Source: Public Records
Map
Nearby Homes
- 3018 Heatherbrook Trace
- 3021 Heatherbrook Trace
- 164 Henley St
- 552 Steels Bridge Rd
- 711 Tall Oaks Dr
- 160 Henley St Unit 15
- 160 Henley St
- Jasper II Plan at Cambridge at Steels Bridge
- Newton II Plan at Cambridge at Steels Bridge
- Fulton II Plan at Cambridge at Steels Bridge
- Brookwood Plan at Cambridge at Steels Bridge
- Tifton II Plan at Cambridge at Steels Bridge
- 109 Hale View Cir
- 238 Parc Dr
- 211 Parc Dr
- 601 Redwood Ln
- 829 Valley Dr
- 331 Laurel Glen Crossing
- 265 Parc Dr
- 834 Valley Dr Unit 1K
- 2018 Greenhill Pass
- 2022 Greenhill Pass
- 2024 Greenhill Pass Unit 2B
- 2016 Greenhill Pass Unit 2B
- 2016 Greenhill Pass Unit 2016
- 2016 Greenhill Pass
- 2014 Greenhill Pass Unit 2B
- 2026 Greenhill Pass Unit 2B
- 608 Hillhouse Lodge Ln
- 604 Hillhouse Lodge Ln
- 618 Hillhouse Lodge Ln
- 2017 Greenhill Pass
- 2015 Greenhill Pass
- 2019 Greenhill Pass Unit 2B
- 2021 Greenhill Pass Unit Ga1401
- 2021 Greenhill Pass
- 2021 Greenhill Pass Unit GA14012
- 2011 Greenhill Pass
- 2028 Greenhill Pass Unit 2B
- 2023 Greenhill Pass