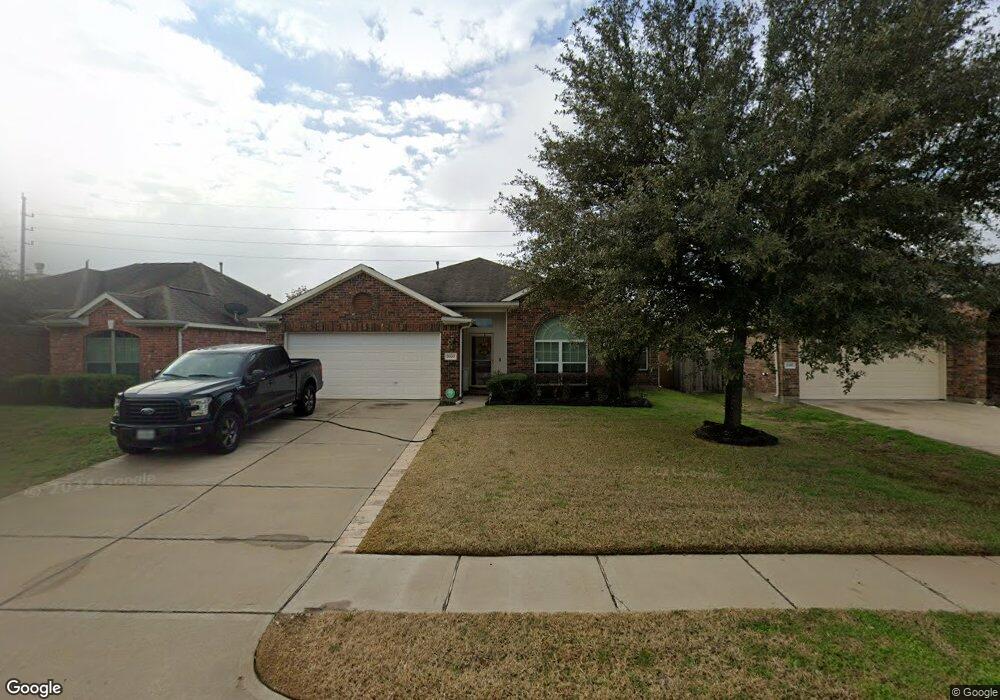
2020 Haven Springs Ln Richmond, TX 77469
Estimated Value: $298,000 - $350,000
3
Beds
2
Baths
1,846
Sq Ft
$175/Sq Ft
Est. Value
About This Home
This home is located at 2020 Haven Springs Ln, Richmond, TX 77469 and is currently estimated at $322,487, approximately $174 per square foot. 2020 Haven Springs Ln is a home located in Fort Bend County with nearby schools including J J Wessendorff Middle School, Lamar Junior High School, and Lamar Consolidated High School.
Ownership History
Date
Name
Owned For
Owner Type
Purchase Details
Closed on
Jun 17, 2011
Sold by
Leckhampton Homes Llc
Bought by
Rendon Gerardo and Rendon Patricia
Current Estimated Value
Home Financials for this Owner
Home Financials are based on the most recent Mortgage that was taken out on this home.
Original Mortgage
$134,403
Outstanding Balance
$93,132
Interest Rate
4.74%
Mortgage Type
FHA
Estimated Equity
$229,355
Purchase Details
Closed on
Dec 6, 2010
Sold by
Deerwood Homes
Bought by
Rendon Gerardo and Rendon Patricia
Purchase Details
Closed on
Mar 15, 2006
Sold by
Ransom Partners Ltd
Bought by
Deerwood Homes Jlf Lp
Home Financials for this Owner
Home Financials are based on the most recent Mortgage that was taken out on this home.
Original Mortgage
$424,800
Interest Rate
6.21%
Mortgage Type
Purchase Money Mortgage
Create a Home Valuation Report for This Property
The Home Valuation Report is an in-depth analysis detailing your home's value as well as a comparison with similar homes in the area
Home Values in the Area
Average Home Value in this Area
Purchase History
| Date | Buyer | Sale Price | Title Company |
|---|---|---|---|
| Rendon Gerardo | -- | Charter Title Company | |
| Rendon Gerardo | -- | -- | |
| Deerwood Homes Jlf Lp | -- | Charter Title Ft Bend | |
| Rendon Gerardo | -- | -- |
Source: Public Records
Mortgage History
| Date | Status | Borrower | Loan Amount |
|---|---|---|---|
| Open | Rendon Gerardo | $134,403 | |
| Previous Owner | Deerwood Homes Jlf Lp | $424,800 |
Source: Public Records
Tax History Compared to Growth
Tax History
| Year | Tax Paid | Tax Assessment Tax Assessment Total Assessment is a certain percentage of the fair market value that is determined by local assessors to be the total taxable value of land and additions on the property. | Land | Improvement |
|---|---|---|---|---|
| 2025 | $4,467 | $323,846 | $45,500 | $279,611 |
| 2024 | $4,467 | $294,405 | $8,051 | $286,354 |
| 2023 | $4,562 | $267,641 | $0 | $298,232 |
| 2022 | $4,976 | $243,310 | $6,280 | $237,030 |
| 2021 | $5,253 | $221,190 | $35,000 | $186,190 |
| 2020 | $5,207 | $216,070 | $35,000 | $181,070 |
| 2019 | $5,561 | $217,730 | $35,000 | $182,730 |
| 2018 | $5,085 | $197,940 | $35,000 | $162,940 |
| 2017 | $5,076 | $195,300 | $35,000 | $160,300 |
| 2016 | $5,168 | $198,840 | $35,000 | $163,840 |
| 2015 | $4,233 | $180,760 | $35,000 | $145,760 |
| 2014 | $3,992 | $164,330 | $35,000 | $129,330 |
Source: Public Records
Map
Nearby Homes
- 1911 Winston Store Loop
- 2008 Golden Creek Ln
- 1810 Winston Store Loop
- 23619 Lively Ferry Ln
- 2227 Marian Lee Ln
- 24007 Barnett Overlook
- 23714 Sweeny Valley Dr
- 23719 Sweeny Valley Dr
- 2030 Hays Ranch Dr
- 1622 Boone Hollow Ln
- 23743 Travers Hill Rd
- 2236 Par Ln
- 23814 Pullin Market Dr
- 406 Fairway Dr
- 2811 Cone Flower Dr
- 1415 Stuart Run Dr
- 342 Ranch House Ln
- 1311 Hudgins Pass
- 3710 Saddlebag Way
- 2001 Briar Ln
- 2022 Haven Springs Ln
- 2024 Haven Springs Ln
- 2018 Haven Springs Ln
- 2026 Haven Springs Ln
- 2023 Haven Springs Ln
- 2021 Haven Springs Ln
- 136 Long Canyon Ln
- 2028 Haven Springs Ln
- 2019 Haven Springs Ln
- 1846 Eli Fenn Dr
- 2016 Haven Springs Ln
- 1842 Eli Fenn Dr
- 134 Long Canyon Ln
- 141 Long Canyon Ln
- 1838 Eli Fenn Dr
- 2014 Haven Springs Ln
- 139 Long Canyon Ln
- 132 Long Canyon Ln
- 2017 Haven Springs Ln
- 137 Long Canyon Ln