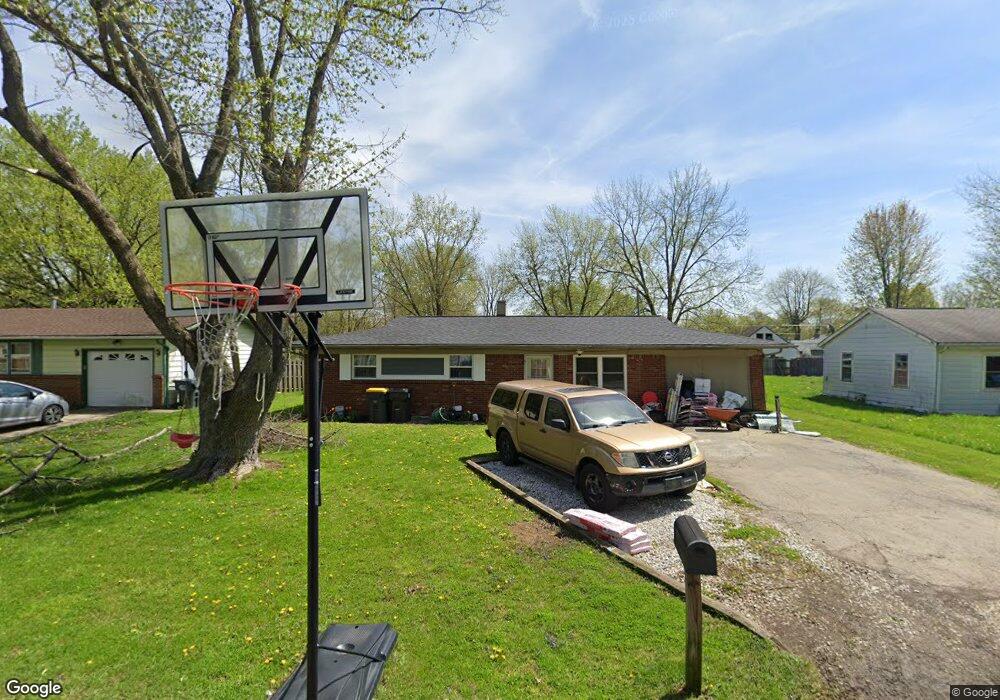
2020 Manger Ln Anderson, IN 46011
Estimated Value: $79,000 - $214,000
3
Beds
2
Baths
1,508
Sq Ft
$104/Sq Ft
Est. Value
About This Home
This home is located at 2020 Manger Ln, Anderson, IN 46011 and is currently estimated at $156,957, approximately $104 per square foot. 2020 Manger Ln is a home located in Madison County with nearby schools including Anderson Elementary School, Highland Middle School, and Anderson High School.
Ownership History
Date
Name
Owned For
Owner Type
Purchase Details
Closed on
Apr 6, 2021
Sold by
First National City Mtg A Division Of Na
Bought by
Lopez Imelda Martinez and Lopez Jorge
Current Estimated Value
Purchase Details
Closed on
Sep 30, 2015
Sold by
Hart
Bought by
First Co
Purchase Details
Closed on
Dec 14, 2011
Sold by
Hart Ronald E and Hart Michael J
Bought by
Lopez Imelda and Lopez Jorge
Purchase Details
Closed on
Oct 4, 2011
Sold by
Smith Joshua R and Hawkins Jessica L
Bought by
Hart Ronald E and Hart Michael J
Purchase Details
Closed on
Jul 1, 2010
Sold by
Owb Reo Llc
Bought by
Hart Ronald E and Hart Michael J
Purchase Details
Closed on
Jan 26, 2010
Sold by
Onewest Bank Fsb
Bought by
Imb Reo Llc
Purchase Details
Closed on
Jan 22, 2010
Sold by
Thomas Rodney Alan and Thomas Kelly M
Bought by
Onewest Bank Fsb
Create a Home Valuation Report for This Property
The Home Valuation Report is an in-depth analysis detailing your home's value as well as a comparison with similar homes in the area
Home Values in the Area
Average Home Value in this Area
Purchase History
| Date | Buyer | Sale Price | Title Company |
|---|---|---|---|
| Lopez Imelda Martinez | $48,000 | None Available | |
| First Co | $29,500 | -- | |
| First National Acceptance Co | -- | -- | |
| Lopez Imelda | $48,000 | None Available | |
| Hart Ronald E | -- | None Available | |
| Hart Ronald E | -- | None Available | |
| Imb Reo Llc | -- | -- | |
| Onewest Bank Fsb | $35,000 | -- |
Source: Public Records
Tax History Compared to Growth
Tax History
| Year | Tax Paid | Tax Assessment Tax Assessment Total Assessment is a certain percentage of the fair market value that is determined by local assessors to be the total taxable value of land and additions on the property. | Land | Improvement |
|---|---|---|---|---|
| 2025 | $773 | $73,200 | $10,300 | $62,900 |
| 2024 | $773 | $73,200 | $10,300 | $62,900 |
| 2023 | $709 | $67,100 | $9,800 | $57,300 |
| 2022 | $712 | $67,100 | $9,200 | $57,900 |
| 2021 | $639 | $61,600 | $9,100 | $52,500 |
| 2020 | $643 | $61,800 | $8,700 | $53,100 |
| 2019 | $586 | $56,600 | $8,700 | $47,900 |
| 2018 | $552 | $52,000 | $8,700 | $43,300 |
| 2017 | $515 | $61,400 | $8,700 | $52,700 |
| 2016 | $609 | $61,400 | $8,700 | $52,700 |
| 2014 | $445 | $51,100 | $8,800 | $42,300 |
| 2013 | $445 | $51,100 | $8,800 | $42,300 |
Source: Public Records
Map
Nearby Homes
- 2015 Rosewood Dr
- 0 Oak Ct Unit LotWP001 24609107
- 0 Oak Ct Unit MBR22059682
- 2121 Euclid Dr
- 1820 Euclid Dr
- 3008 Nichol Ave
- 118 Winding Way
- 34 Colony Rd
- 908 Wayside Ln
- 3134 Meadowcrest Dr
- 718 Longfellow Rd
- 1827 Fulton St
- 0 Fulton St Unit MBR22051501
- 2308 W 16th St
- 2401 W 27th St
- 45 Spring Valley Dr
- 1818 Dewey St
- 1620 Winding Way
- 2205 Nichol Ave
- 2104 W 16th St
- 2014 Manger Ln
- 2110 Manger Ln
- 2021 Rosewood Dr
- 2008 Manger Ln
- 2116 Manger Ln
- 2111 Rosewood Dr
- 3110 W 22nd St
- 2011 Rosewood Dr
- 2109 Manger Ln
- 2015 Manger Ln
- 2004 Manger Ln
- 2009 Manger Ln
- 2115 Manger Ln
- 2003 Rosewood Dr
- 1916 Manger Ln
- 2003 Manger Ln
- 3205 W 20th St
- 3127 W 22nd St
- 2112 Rosewood Dr
- 3121 W 22nd St