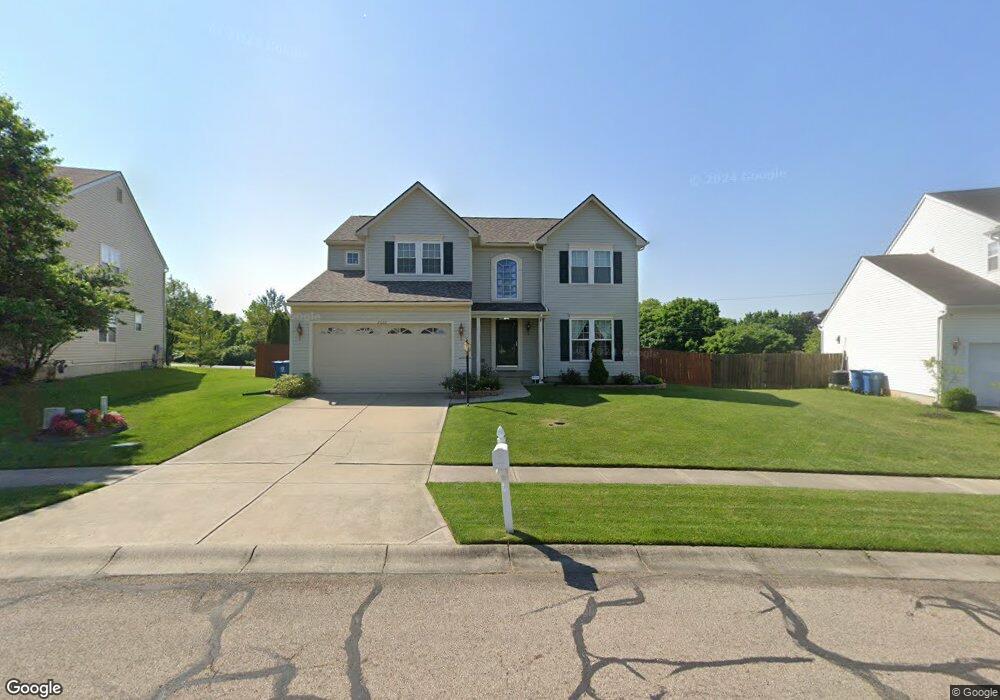
2020 Matt Way Dayton, OH 45424
Forest Ridge Quail Hollow NeighborhoodEstimated Value: $355,000 - $393,000
4
Beds
4
Baths
2,584
Sq Ft
$143/Sq Ft
Est. Value
About This Home
This home is located at 2020 Matt Way, Dayton, OH 45424 and is currently estimated at $370,709, approximately $143 per square foot. 2020 Matt Way is a home located in Montgomery County with nearby schools including Stebbins High School, Pathway School of Discovery, and St. Helen Elementary School.
Ownership History
Date
Name
Owned For
Owner Type
Purchase Details
Closed on
Mar 27, 2013
Sold by
North Mary Ellen
Bought by
North John B and Santos North Marilia Da Costa
Current Estimated Value
Home Financials for this Owner
Home Financials are based on the most recent Mortgage that was taken out on this home.
Original Mortgage
$137,267
Outstanding Balance
$27,797
Interest Rate
2.72%
Mortgage Type
Future Advance Clause Open End Mortgage
Estimated Equity
$342,912
Purchase Details
Closed on
Mar 26, 2010
Sold by
Nvr Inc
Bought by
North John B and North Marilia Da Costa Santos
Home Financials for this Owner
Home Financials are based on the most recent Mortgage that was taken out on this home.
Original Mortgage
$197,181
Interest Rate
5.5%
Mortgage Type
FHA
Purchase Details
Closed on
Dec 31, 2009
Sold by
Nvr Ohio Acquisition Llc
Bought by
Nvr Inc
Purchase Details
Closed on
Jun 20, 2008
Sold by
Beazer Homes Investments Llc
Bought by
Nvr Ohio Acquisition Llc
Create a Home Valuation Report for This Property
The Home Valuation Report is an in-depth analysis detailing your home's value as well as a comparison with similar homes in the area
Home Values in the Area
Average Home Value in this Area
Purchase History
| Date | Buyer | Sale Price | Title Company |
|---|---|---|---|
| North John B | -- | None Available | |
| North John B | $236,600 | None Available | |
| Nvr Inc | -- | First Title Agency | |
| Nvr Ohio Acquisition Llc | $887,600 | Attorney |
Source: Public Records
Mortgage History
| Date | Status | Borrower | Loan Amount |
|---|---|---|---|
| Open | North John B | $137,267 | |
| Closed | North John B | $197,181 |
Source: Public Records
Tax History Compared to Growth
Tax History
| Year | Tax Paid | Tax Assessment Tax Assessment Total Assessment is a certain percentage of the fair market value that is determined by local assessors to be the total taxable value of land and additions on the property. | Land | Improvement |
|---|---|---|---|---|
| 2024 | $4,797 | $100,230 | $15,050 | $85,180 |
| 2023 | $4,797 | $100,230 | $15,050 | $85,180 |
| 2022 | $5,006 | $78,310 | $11,760 | $66,550 |
| 2021 | $5,102 | $78,310 | $11,760 | $66,550 |
| 2020 | $5,103 | $78,310 | $11,760 | $66,550 |
| 2019 | $4,888 | $66,890 | $9,800 | $57,090 |
| 2018 | $4,898 | $66,890 | $9,800 | $57,090 |
| 2017 | $4,872 | $66,890 | $9,800 | $57,090 |
| 2016 | $4,851 | $64,620 | $9,800 | $54,820 |
| 2015 | $4,934 | $64,620 | $9,800 | $54,820 |
| 2014 | $4,934 | $64,620 | $9,800 | $54,820 |
| 2012 | -- | $70,370 | $10,500 | $59,870 |
Source: Public Records
Map
Nearby Homes
- 5027 Katherine Ct
- 4330 Coach Light Trail
- 4416 Hawk Watch Way
- 0 Forest Ridge Blvd Unit 937866
- 3344 Vagabond Ln
- 3322 Vagabond Ln
- 5408 Zachary Ln
- 4925 Honeywood Ct
- 5411 Zachary Ln
- 5415 Zachary Ln
- 5418 Zachary Ln
- 5419 Zachary Ln
- 4222 Meadowsweet Dr
- 5423 Zachary Ln
- 4048 Quail Bush Dr
- 5224 Sweetleaf Dr
- 2512 Harshman Rd
- 2520 Harshman Rd
- 4631 Strathaven Dr
- 2744 Amberwood Dr Unit 17-203