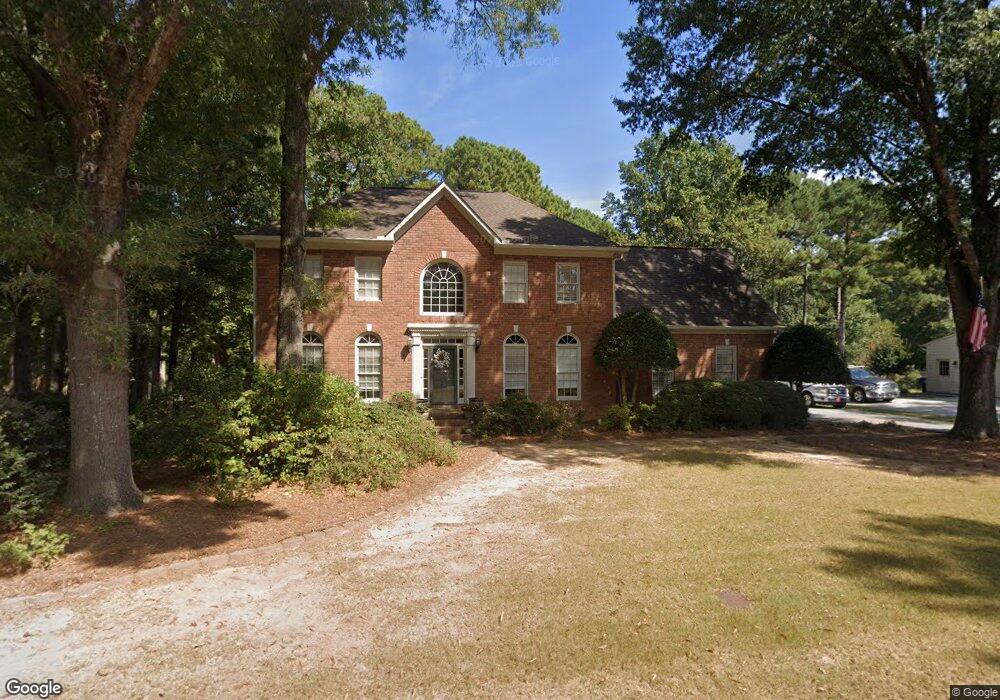
2020 Milfield Cir Unit 2 Snellville, GA 30078
Estimated Value: $500,054 - $563,000
3
Beds
3
Baths
3,071
Sq Ft
$177/Sq Ft
Est. Value
About This Home
This home is located at 2020 Milfield Cir Unit 2, Snellville, GA 30078 and is currently estimated at $543,764, approximately $177 per square foot. 2020 Milfield Cir Unit 2 is a home located in Gwinnett County with nearby schools including Craig Elementary School, Alton C. Crews Middle School, and Brookwood High School.
Ownership History
Date
Name
Owned For
Owner Type
Purchase Details
Closed on
Mar 14, 2025
Sold by
Charmoli Robert M
Bought by
Charmoli Candi Carnes and Charmoli Robert Michael
Current Estimated Value
Purchase Details
Closed on
Aug 11, 2006
Sold by
Winskie John E and Winskie Stacey B
Bought by
Charmoli Robert M and Charmoli Candi
Home Financials for this Owner
Home Financials are based on the most recent Mortgage that was taken out on this home.
Original Mortgage
$268,200
Interest Rate
6.71%
Mortgage Type
New Conventional
Purchase Details
Closed on
Jun 28, 2000
Sold by
Trinsey John S and Trinsey Janet B
Bought by
Winskie John E and Winskie Stacey B
Home Financials for this Owner
Home Financials are based on the most recent Mortgage that was taken out on this home.
Original Mortgage
$199,200
Interest Rate
8.63%
Mortgage Type
New Conventional
Create a Home Valuation Report for This Property
The Home Valuation Report is an in-depth analysis detailing your home's value as well as a comparison with similar homes in the area
Home Values in the Area
Average Home Value in this Area
Purchase History
| Date | Buyer | Sale Price | Title Company |
|---|---|---|---|
| Charmoli Candi Carnes | -- | -- | |
| Charmoli Robert M | $298,000 | -- | |
| Winskie John E | $217,500 | -- |
Source: Public Records
Mortgage History
| Date | Status | Borrower | Loan Amount |
|---|---|---|---|
| Previous Owner | Charmoli Robert M | $268,200 | |
| Previous Owner | Winskie John E | $199,200 |
Source: Public Records
Tax History Compared to Growth
Tax History
| Year | Tax Paid | Tax Assessment Tax Assessment Total Assessment is a certain percentage of the fair market value that is determined by local assessors to be the total taxable value of land and additions on the property. | Land | Improvement |
|---|---|---|---|---|
| 2025 | $6,279 | $232,760 | $36,000 | $196,760 |
| 2024 | $5,439 | $184,040 | $36,000 | $148,040 |
| 2023 | $5,439 | $217,560 | $37,600 | $179,960 |
| 2022 | $5,621 | $194,400 | $35,200 | $159,200 |
| 2021 | $4,711 | $146,560 | $26,000 | $120,560 |
| 2020 | $4,745 | $146,560 | $26,000 | $120,560 |
| 2019 | $4,615 | $146,560 | $26,000 | $120,560 |
| 2018 | $4,625 | $146,560 | $26,000 | $120,560 |
| 2016 | $3,765 | $106,040 | $18,400 | $87,640 |
| 2015 | $3,803 | $106,040 | $18,400 | $87,640 |
| 2014 | $3,823 | $106,040 | $18,400 | $87,640 |
Source: Public Records
Map
Nearby Homes
- 1870 Milfield Cir
- 1130 Fieldgate Rd
- 1550 Laurelhill Dr
- 1220 Fieldgate Rd
- 562 Grassmeade Way
- 543 Grassmeade Way
- 1269 Gate Post Ln
- 2061 Vicarage Ln
- 1935 Shrader Ct
- 2071 Havenview Ct
- 1381 Providence Dr Unit 4
- 1620 Brook Ivy Dr
- 1676 Heritage Dr
- 1478 Napier Terrace
- 1757 Litchfield Rd Unit 3
- 1737 Litchfield Rd
- 1368 Branchwood Dr
- 811 Millvale Place
- 1955 Branchwood Ct Unit 1
- 2034 Janmar Ct
- 2030 Milfield Cir
- 2010 Milfield Cir Unit 2
- 1108 Lynhurst Ln Unit 2
- 1087 Hardwyck Pass Unit 2
- 2015 Milfield Cir
- 1839 Kenion Point Unit 2
- 2040 Milfield Cir
- 1077 Hardwyck Pass
- 1077 Lynhurst Ln
- 1117 Hardwyck Pass
- 2005 Milfield Cir
- 1849 Kenion Point
- 2045 Milfield Cir
- 1119 Lynhurst Ln
- 2050 Milfield Cir
- 1109 Lynhurst Ln
- 2000 Milfield Cir
- 1099 Lynhurst Ln
- 1848 Kenion Point
- 1106 Hardwyck Pass