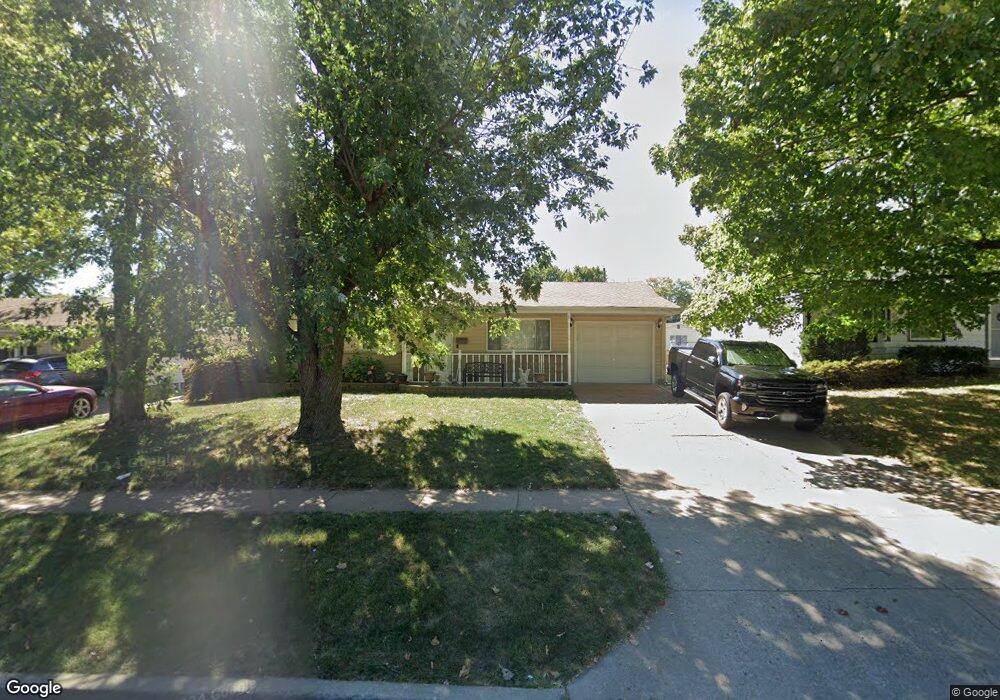
2020 Mullanphy Ln Florissant, MO 63031
Estimated Value: $146,000 - $173,938
3
Beds
2
Baths
1,036
Sq Ft
$157/Sq Ft
Est. Value
About This Home
This home is located at 2020 Mullanphy Ln, Florissant, MO 63031 and is currently estimated at $162,485, approximately $156 per square foot. 2020 Mullanphy Ln is a home located in St. Louis County with nearby schools including Lusher Elementary School, Northwest Middle School, and Hazelwood West High School.
Ownership History
Date
Name
Owned For
Owner Type
Purchase Details
Closed on
Oct 9, 2020
Sold by
Nagel Clifford and Nagel Wendy
Bought by
Nagel Clifford and Nagel Wendy
Current Estimated Value
Home Financials for this Owner
Home Financials are based on the most recent Mortgage that was taken out on this home.
Original Mortgage
$89,000
Outstanding Balance
$63,133
Interest Rate
2.3%
Mortgage Type
New Conventional
Estimated Equity
$99,352
Purchase Details
Closed on
Jun 27, 2006
Sold by
Jpmorgan Chase Bank
Bought by
Nagel Clifford
Home Financials for this Owner
Home Financials are based on the most recent Mortgage that was taken out on this home.
Original Mortgage
$108,300
Interest Rate
6.67%
Mortgage Type
FHA
Purchase Details
Closed on
Mar 8, 2006
Sold by
Asquith Jason B and Asquith Katherine L
Bought by
Jp Morgan Chase Bank
Purchase Details
Closed on
Jul 11, 2003
Sold by
Asquith Katherine L and Asquith Jason B
Bought by
Asquith Jason B and Asquith Katherine L
Purchase Details
Closed on
May 25, 2001
Sold by
Albers Kenneth F and Albers Etta A
Bought by
Bandy Stacy Lynn
Home Financials for this Owner
Home Financials are based on the most recent Mortgage that was taken out on this home.
Original Mortgage
$91,179
Interest Rate
7.1%
Mortgage Type
FHA
Create a Home Valuation Report for This Property
The Home Valuation Report is an in-depth analysis detailing your home's value as well as a comparison with similar homes in the area
Home Values in the Area
Average Home Value in this Area
Purchase History
| Date | Buyer | Sale Price | Title Company |
|---|---|---|---|
| Nagel Clifford | -- | Copper Title Llc | |
| Nagel Clifford | $110,000 | None Available | |
| Jp Morgan Chase Bank | $97,750 | None Available | |
| Asquith Jason B | -- | -- | |
| Bandy Stacy Lynn | $91,900 | -- | |
| Bandy Stacy Lynn | -- | -- |
Source: Public Records
Mortgage History
| Date | Status | Borrower | Loan Amount |
|---|---|---|---|
| Open | Nagel Clifford | $89,000 | |
| Closed | Nagel Clifford | $108,300 | |
| Previous Owner | Bandy Stacy Lynn | $91,179 |
Source: Public Records
Tax History Compared to Growth
Tax History
| Year | Tax Paid | Tax Assessment Tax Assessment Total Assessment is a certain percentage of the fair market value that is determined by local assessors to be the total taxable value of land and additions on the property. | Land | Improvement |
|---|---|---|---|---|
| 2025 | $2,295 | $30,440 | $4,660 | $25,780 |
| 2024 | $2,295 | $25,600 | $3,120 | $22,480 |
| 2023 | $2,291 | $25,600 | $3,120 | $22,480 |
| 2022 | $2,151 | $21,420 | $4,050 | $17,370 |
| 2021 | $2,095 | $21,420 | $4,050 | $17,370 |
| 2020 | $1,967 | $18,910 | $4,050 | $14,860 |
| 2019 | $1,937 | $18,910 | $4,050 | $14,860 |
| 2018 | $1,782 | $15,980 | $2,430 | $13,550 |
| 2017 | $1,780 | $15,980 | $2,430 | $13,550 |
| 2016 | $1,643 | $14,530 | $2,430 | $12,100 |
| 2015 | $1,608 | $14,530 | $2,430 | $12,100 |
| 2014 | $1,770 | $16,510 | $3,530 | $12,980 |
Source: Public Records
Map
Nearby Homes
- 1270 Bobolink Dr
- 1380 Thrush Ln
- 1825 Swallow Ln
- 2370 Hawthorne Manor Dr
- 200 Francisca Dr
- 25 Francisca Dr
- 1505 Swallow Ln
- 2048 New Sun Dr
- 2515 Flamingo Dr
- 1920 High Sun Dr
- 1415 Boulder Dr
- 1863 High Sun Dr Unit 51863
- 1885 High Sun Dr
- 2 Meadows
- 1405 Miller Dr
- 1830 New Sun Ct
- 2 Belmont at River Bluffs Meadows
- 2040 Splendor Dr
- 2165 Jenkee Dr
- 1395 Bluebird Dr
- 1980 Mullanphy Ln
- 2040 Mullanphy Ln
- 2025 David Dr
- 1960 Mullanphy Ln
- 2060 Mullanphy Ln
- 1985 David Dr
- 2045 David Dr
- 1965 David Dr
- 2065 David Dr
- 2080 Mullanphy Ln
- 1945 David Dr
- 2085 David Dr
- 2085 Mullanphy Ln
- 2120 Mullanphy Ln
- 1920 Mullanphy Ln
- 1220 Bobolink Dr
- 2125 David Dr
- 1185 Randell Ct
- 2000 David Dr
- 1980 David Dr