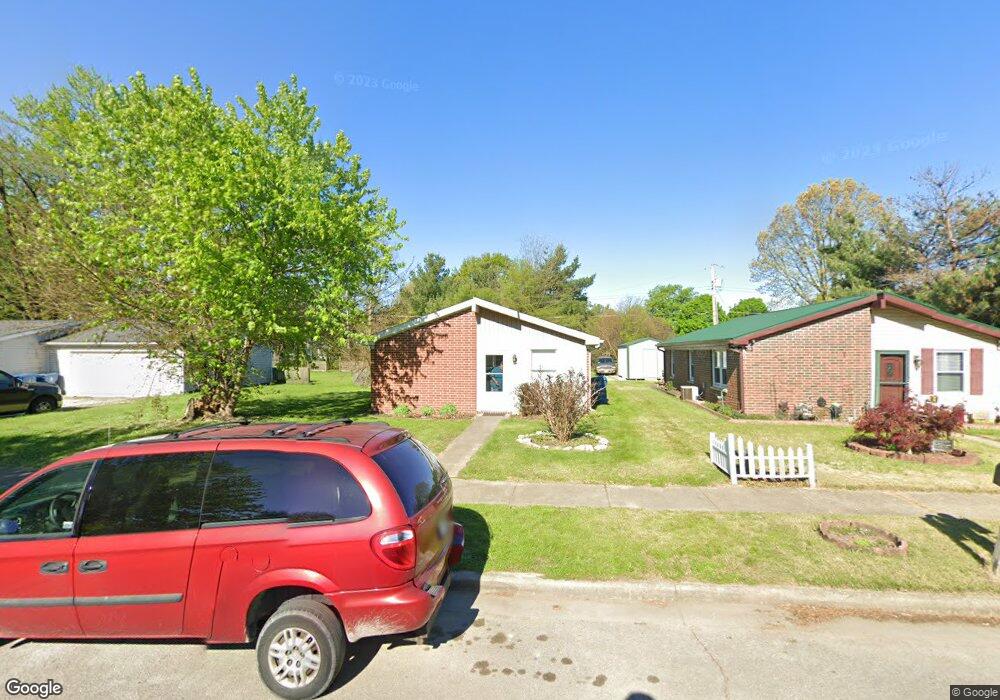
2020 N 28th St Terre Haute, IN 47804
Sheridan Park NeighborhoodEstimated Value: $53,000 - $102,000
3
Beds
1
Bath
1,025
Sq Ft
$78/Sq Ft
Est. Value
About This Home
This home is located at 2020 N 28th St, Terre Haute, IN 47804 and is currently estimated at $79,570, approximately $77 per square foot. 2020 N 28th St is a home located in Vigo County with nearby schools including Benjamin Franklin Elementary School, Woodrow Wilson Middle School, and Terre Haute North Vigo High School.
Ownership History
Date
Name
Owned For
Owner Type
Purchase Details
Closed on
Jul 15, 2013
Sold by
Tuchman Steven L and Bodrick Reed E
Bought by
The Vii Llc
Current Estimated Value
Purchase Details
Closed on
May 16, 2013
Sold by
Fannie Mae
Bought by
Tuchman Steven L and Bobrick Reed E
Purchase Details
Closed on
Dec 12, 2012
Sold by
Bills Daretta
Bought by
Federal National Mortgage Association
Create a Home Valuation Report for This Property
The Home Valuation Report is an in-depth analysis detailing your home's value as well as a comparison with similar homes in the area
Home Values in the Area
Average Home Value in this Area
Purchase History
| Date | Buyer | Sale Price | Title Company |
|---|---|---|---|
| The Vii Llc | -- | None Available | |
| Tuchman Steven L | $24,000 | None Available | |
| Federal National Mortgage Association | -- | None Available |
Source: Public Records
Tax History Compared to Growth
Tax History
| Year | Tax Paid | Tax Assessment Tax Assessment Total Assessment is a certain percentage of the fair market value that is determined by local assessors to be the total taxable value of land and additions on the property. | Land | Improvement |
|---|---|---|---|---|
| 2024 | $774 | $35,800 | $2,900 | $32,900 |
| 2023 | $774 | $35,800 | $3,400 | $32,400 |
| 2022 | $774 | $35,800 | $3,300 | $32,500 |
| 2021 | $774 | $35,800 | $3,500 | $32,300 |
| 2020 | $774 | $35,800 | $3,400 | $32,400 |
| 2019 | $773 | $35,800 | $3,400 | $32,400 |
| 2018 | $1,002 | $33,400 | $3,300 | $30,100 |
| 2017 | $656 | $32,800 | $3,300 | $29,500 |
| 2016 | $664 | $33,200 | $3,300 | $29,900 |
| 2014 | $1,002 | $50,100 | $4,900 | $45,200 |
| 2013 | $1,002 | $49,100 | $4,800 | $44,300 |
Source: Public Records
Map
Nearby Homes