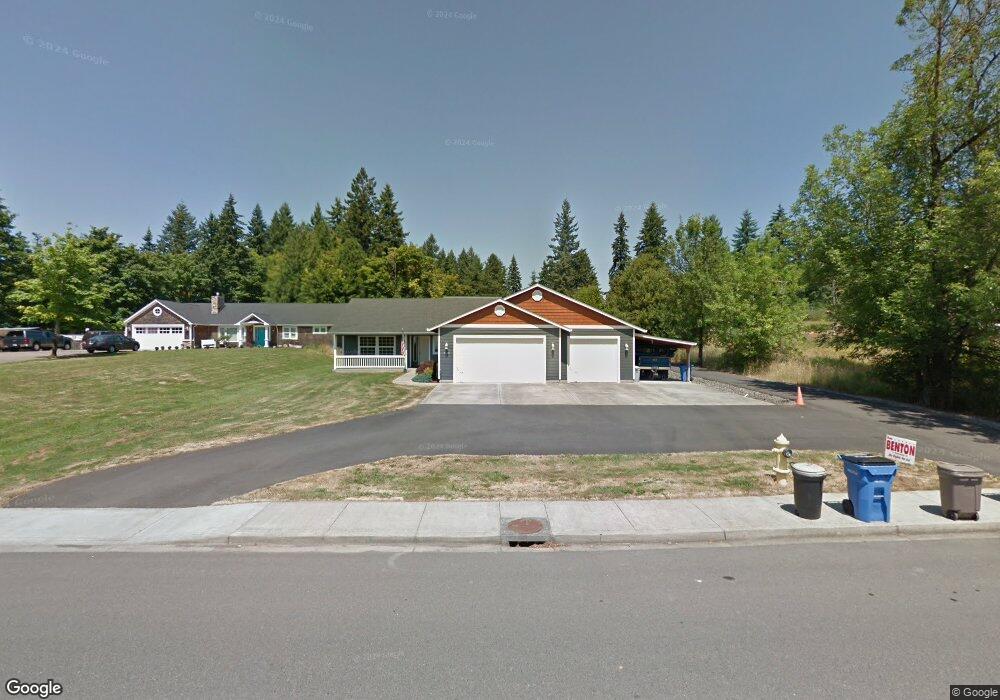
2020 NE 159th St Ridgefield, WA 98642
Estimated Value: $520,000 - $846,000
4
Beds
4
Baths
1,986
Sq Ft
$324/Sq Ft
Est. Value
About This Home
This home is located at 2020 NE 159th St, Ridgefield, WA 98642 and is currently estimated at $644,363, approximately $324 per square foot. 2020 NE 159th St is a home located in Clark County with nearby schools including Salmon Creek Elementary School, Alki Middle School, and Skyview High School.
Ownership History
Date
Name
Owned For
Owner Type
Purchase Details
Closed on
Dec 30, 2020
Sold by
Holmgren Eric N and Estate Of Daniel Holmgren
Bought by
Holmgren Jared
Current Estimated Value
Home Financials for this Owner
Home Financials are based on the most recent Mortgage that was taken out on this home.
Original Mortgage
$380,000
Outstanding Balance
$339,092
Interest Rate
2.7%
Mortgage Type
New Conventional
Estimated Equity
$305,271
Purchase Details
Closed on
Jul 12, 2004
Sold by
Liberty Homes Inc
Bought by
Holmgren Daniel
Home Financials for this Owner
Home Financials are based on the most recent Mortgage that was taken out on this home.
Original Mortgage
$160,000
Interest Rate
6.27%
Mortgage Type
Purchase Money Mortgage
Create a Home Valuation Report for This Property
The Home Valuation Report is an in-depth analysis detailing your home's value as well as a comparison with similar homes in the area
Home Values in the Area
Average Home Value in this Area
Purchase History
| Date | Buyer | Sale Price | Title Company |
|---|---|---|---|
| Holmgren Jared | $380,000 | Wfg Natl Ttl Co Of Clark Cnt | |
| Holmgren Daniel | $200,000 | Chicago Title Insurance | |
| Liberty Homes Inc | -- | Chicago Title Insurance |
Source: Public Records
Mortgage History
| Date | Status | Borrower | Loan Amount |
|---|---|---|---|
| Open | Holmgren Jared | $380,000 | |
| Previous Owner | Holmgren Daniel | $160,000 |
Source: Public Records
Tax History Compared to Growth
Tax History
| Year | Tax Paid | Tax Assessment Tax Assessment Total Assessment is a certain percentage of the fair market value that is determined by local assessors to be the total taxable value of land and additions on the property. | Land | Improvement |
|---|---|---|---|---|
| 2025 | $5,213 | $520,145 | $199,699 | $320,446 |
| 2024 | $4,852 | $501,442 | $199,699 | $301,743 |
| 2023 | $4,669 | $506,400 | $207,530 | $298,870 |
| 2022 | $4,897 | $600,182 | $195,783 | $404,399 |
| 2021 | $4,689 | $450,468 | $182,755 | $267,713 |
| 2020 | $651 | $404,576 | $162,330 | $242,246 |
| 2019 | $659 | $371,335 | $162,330 | $209,005 |
| 2018 | $709 | $99,449 | $0 | $0 |
| 2017 | $3,516 | $330,356 | $0 | $0 |
| 2016 | $3,169 | $295,023 | $0 | $0 |
| 2015 | $3,117 | $248,623 | $0 | $0 |
| 2014 | -- | $236,293 | $0 | $0 |
| 2013 | -- | $201,194 | $0 | $0 |
Source: Public Records
Map
Nearby Homes
- 2012 NE 159th St
- 15711 NE 22nd Ave
- 2513 NE 158th St
- 2519 NE 159th St
- 15917 NE Union Rd Unit 5
- 15917 NE Union Rd Unit 46
- 2707 NE 159th Cir
- 15502 NE 26th Ave
- 16210 NE 27th Ave
- 2514 NE 163rd St
- 2722 NE 159th Cir
- 15606 NE 15th Place
- 15604 NE 15th Place
- 15602 NE 15th Place
- 15108 NE 22nd Ave
- 2617 NE 166th St
- 17712 NE 25th Ct Unit LOT 2
- 14818 NE 23rd Ave
- 16502 NE 12th Ct
- 3621 NE 168th St
- 15906 NE 22nd Ave
- 15910 NE 22nd Ave
- 2010 NE 159th St
- 2006 NE 159th St Unit 1
- 2008 NE 159th St Unit 2
- 16006 NE 22nd Ave
- 2018 NE 159th St
- 2100 NE 159th St
- 16004 NE 22nd Ave
- 2016 NE 159th St
- 2106 NE 158th Cir
- 2104 NE 159th St
- 2110 NE 158th Cir
- 16008 NE 22nd Ave
- 2022 NE 158th Cir
- 15907 NE 22nd Ave
- 15903 NE 22nd Ave
- 2018 NE 158th Cir
- 2102 NE 158th Cir
- 2200 NE 158th St