Estimated Value: $251,000 - $320,436
3
Beds
2
Baths
2,112
Sq Ft
$136/Sq Ft
Est. Value
About This Home
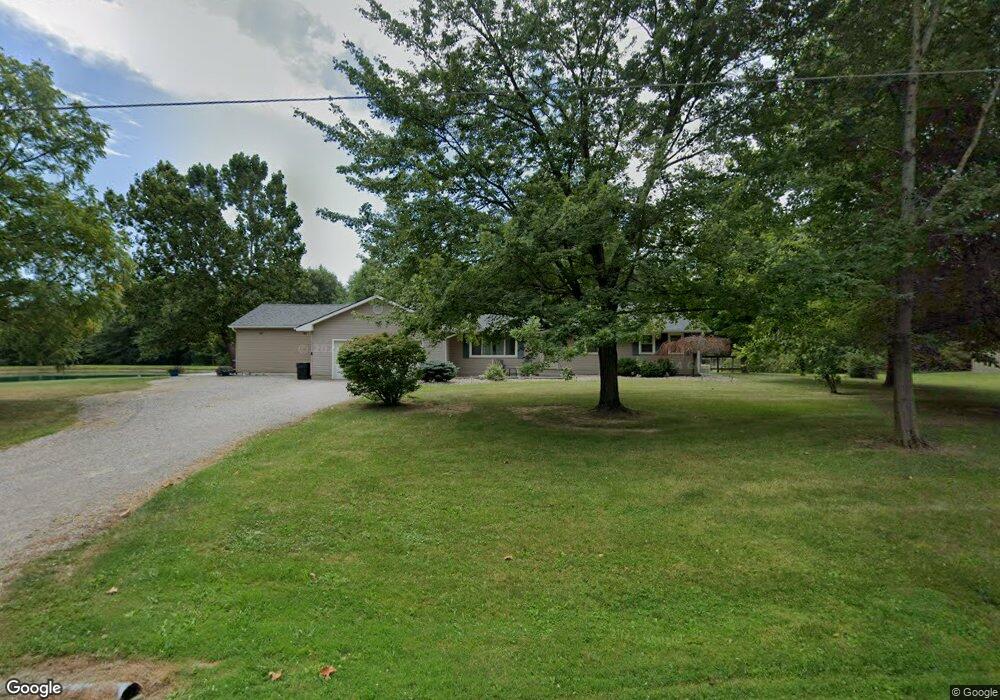
This home is located at 2020 Rainbow Dr, Lima, OH 45801 and is currently estimated at $287,609, approximately $136 per square foot. 2020 Rainbow Dr is a home located in Allen County with nearby schools including Bath Elementary School, Bath Middle School, and Bath High School.
Ownership History
Date
Name
Owned For
Owner Type
Purchase Details
Closed on
May 26, 2005
Sold by
Garmatter Curt R and Garmatter Kelly
Bought by
Toland Timothy and Toland Angela
Current Estimated Value
Home Financials for this Owner
Home Financials are based on the most recent Mortgage that was taken out on this home.
Original Mortgage
$113,600
Outstanding Balance
$60,485
Interest Rate
6.07%
Mortgage Type
Future Advance Clause Open End Mortgage
Estimated Equity
$227,124
Purchase Details
Closed on
Aug 1, 1995
Sold by
Secrist Gerald
Bought by
Garmatter Curt
Home Financials for this Owner
Home Financials are based on the most recent Mortgage that was taken out on this home.
Original Mortgage
$84,000
Interest Rate
7.59%
Mortgage Type
New Conventional
Purchase Details
Closed on
Apr 1, 1974
Bought by
Secrist Gerald L
Create a Home Valuation Report for This Property
The Home Valuation Report is an in-depth analysis detailing your home's value as well as a comparison with similar homes in the area
Purchase History
| Date | Buyer | Sale Price | Title Company |
|---|---|---|---|
| Toland Timothy | $142,000 | None Available | |
| Garmatter Curt | $105,000 | -- | |
| Secrist Gerald L | $9,500 | -- |
Source: Public Records
Mortgage History
| Date | Status | Borrower | Loan Amount |
|---|---|---|---|
| Open | Toland Timothy | $113,600 | |
| Closed | Garmatter Curt | $84,000 |
Source: Public Records
Tax History
| Year | Tax Paid | Tax Assessment Tax Assessment Total Assessment is a certain percentage of the fair market value that is determined by local assessors to be the total taxable value of land and additions on the property. | Land | Improvement |
|---|---|---|---|---|
| 2024 | $3,954 | $90,620 | $15,050 | $75,570 |
| 2023 | $3,030 | $67,520 | $12,740 | $54,780 |
| 2022 | $3,060 | $67,520 | $12,740 | $54,780 |
| 2021 | $3,077 | $67,520 | $12,740 | $54,780 |
| 2020 | $2,806 | $56,070 | $13,160 | $42,910 |
| 2019 | $2,806 | $56,070 | $13,160 | $42,910 |
| 2018 | $2,603 | $56,070 | $13,160 | $42,910 |
| 2017 | $2,470 | $50,260 | $12,950 | $37,310 |
| 2016 | $2,434 | $50,260 | $12,950 | $37,310 |
| 2015 | $2,351 | $50,260 | $12,950 | $37,310 |
| 2014 | $2,351 | $46,660 | $13,160 | $33,500 |
| 2013 | $2,353 | $46,660 | $13,160 | $33,500 |
Source: Public Records
Map
Nearby Homes
- 1085 Lutz Rd
- 3465 Sugar Creek Rd
- 3263 Shiloh Dr
- 201 Wall St
- 102 W Main St
- 513 W Main St
- 634 W Main St
- 2878 Autumn Lake Dr
- 4387 N West St
- 0 N Dixie Hwy Unit 300253
- 535 W Bluelick Rd
- 0 Thorndyke Dr
- 2230 N Dixie Hwy
- 3137 Thorndyke Dr
- 2145 N Dixie Hwy Unit 80
- 2145 N Dixie Hwy Unit 11
- 2145 N Dixie Hwy Unit 101
- 2145 N Dixie Hwy Unit 30
- 475 Kenmore St
- 520 Kenmore St
Your Personal Tour Guide
Ask me questions while you tour the home.