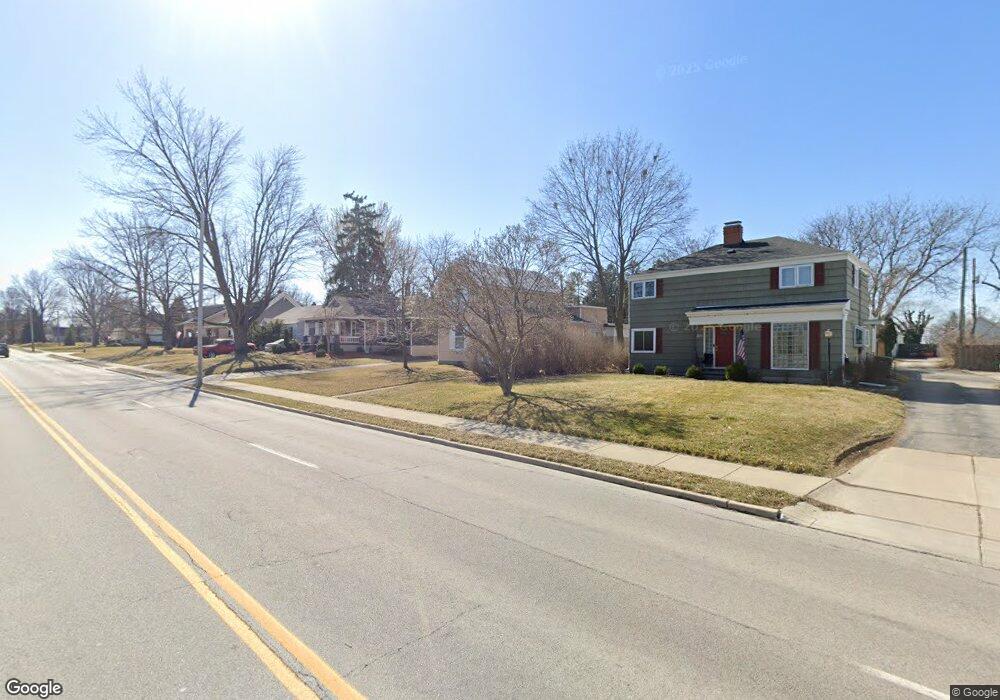
2020 S Main St Findlay, OH 45840
Estimated Value: $193,125 - $262,000
3
Beds
1
Bath
1,556
Sq Ft
$150/Sq Ft
Est. Value
About This Home
This home is located at 2020 S Main St, Findlay, OH 45840 and is currently estimated at $233,281, approximately $149 per square foot. 2020 S Main St is a home located in Hancock County with nearby schools including Jefferson Elementary School, Chamberlin Hill Elementary School, and Donnell Middle School.
Ownership History
Date
Name
Owned For
Owner Type
Purchase Details
Closed on
Nov 2, 2004
Sold by
Reineke Properties Llc
Bought by
Barnes Mark I and Barnes Deborah A
Current Estimated Value
Home Financials for this Owner
Home Financials are based on the most recent Mortgage that was taken out on this home.
Original Mortgage
$120,800
Interest Rate
6.99%
Mortgage Type
Purchase Money Mortgage
Purchase Details
Closed on
Mar 28, 2003
Sold by
Barnes Mark I and Barnes Deborah A
Bought by
Reineke Properties Llc
Home Financials for this Owner
Home Financials are based on the most recent Mortgage that was taken out on this home.
Original Mortgage
$133,000
Interest Rate
5.94%
Mortgage Type
Unknown
Purchase Details
Closed on
Jun 22, 1999
Sold by
Helms Larry
Bought by
Barnes Mark and Barnes Deborah
Home Financials for this Owner
Home Financials are based on the most recent Mortgage that was taken out on this home.
Original Mortgage
$92,700
Interest Rate
7.06%
Mortgage Type
New Conventional
Purchase Details
Closed on
Aug 24, 1992
Bought by
Helms Larry S and Helms Lisa M
Purchase Details
Closed on
Jul 7, 1987
Bought by
Huffman Terry L and Huffman Gwen L
Create a Home Valuation Report for This Property
The Home Valuation Report is an in-depth analysis detailing your home's value as well as a comparison with similar homes in the area
Home Values in the Area
Average Home Value in this Area
Purchase History
| Date | Buyer | Sale Price | Title Company |
|---|---|---|---|
| Barnes Mark I | $151,000 | Archer Land Title Inc | |
| Reineke Properties Llc | $133,000 | Abstract Title | |
| Barnes Mark | $103,000 | -- | |
| Helms Larry S | $62,900 | -- | |
| Huffman Terry L | $32,000 | -- |
Source: Public Records
Mortgage History
| Date | Status | Borrower | Loan Amount |
|---|---|---|---|
| Previous Owner | Barnes Mark I | $120,800 | |
| Previous Owner | Reineke Properties Llc | $133,000 | |
| Previous Owner | Barnes Mark | $92,700 | |
| Closed | Barnes Mark I | $30,200 |
Source: Public Records
Tax History
| Year | Tax Paid | Tax Assessment Tax Assessment Total Assessment is a certain percentage of the fair market value that is determined by local assessors to be the total taxable value of land and additions on the property. | Land | Improvement |
|---|---|---|---|---|
| 2024 | $1,901 | $52,160 | $8,190 | $43,970 |
| 2023 | $1,905 | $52,160 | $8,190 | $43,970 |
| 2022 | $1,898 | $52,160 | $8,190 | $43,970 |
| 2021 | $1,637 | $39,180 | $8,190 | $30,990 |
| 2020 | $1,636 | $39,180 | $8,190 | $30,990 |
| 2019 | $1,604 | $39,180 | $8,190 | $30,990 |
| 2018 | $1,528 | $34,200 | $7,120 | $27,080 |
| 2017 | $1,527 | $34,200 | $7,120 | $27,080 |
| 2016 | $1,513 | $34,200 | $7,120 | $27,080 |
| 2015 | $1,187 | $26,400 | $6,640 | $19,760 |
| 2014 | $1,187 | $26,400 | $6,640 | $19,760 |
| 2012 | $1,198 | $26,400 | $6,640 | $19,760 |
Source: Public Records
Map
Nearby Homes
- 136 E Hobart Ave
- 209 E Hobart Ave
- 207 E Yates Ave
- 242 E Yates Ave
- 130 Oakland Ave
- 400 E Pearl St
- 324 W Mcpherson Ave
- 206 Greenlawn Ave
- 123 Glendale Ave
- 3001 Goldenrod Ln
- 731 5th St
- 313 2nd St
- 1120 S West St
- 1041 S Main St
- 1113 Hurd Ave
- 1638 Westview Dr
- 2925 Goldenrod Ln
- 0 Viburnum Ct Unit 10002881
- 0 Viburnum Ct Unit 10002879
- 0 Viburnum Ct Unit 10002878
- 2010 S Main St
- 2024 S Main St
- 2004 S Main St
- 2028 S Main St
- 2032 S Main St
- 2000 S Main St
- 2036 S Main St
- 116 W Hobart Ave
- 31 E Eagle St
- 122 W Hobart Ave
- 2015 S Main St
- 2021 S Main St
- 2035 S Main St
- 2005 S Main St
- 0 Lot 31 Eagle Dr
- 0 Lot 35 Eagle Dr
- 2108 S Main St
- 126 W Hobart Ave
- 113 W Hobart Ave
- 0 Lot 34 Eagle Dr
Your Personal Tour Guide
Ask me questions while you tour the home.