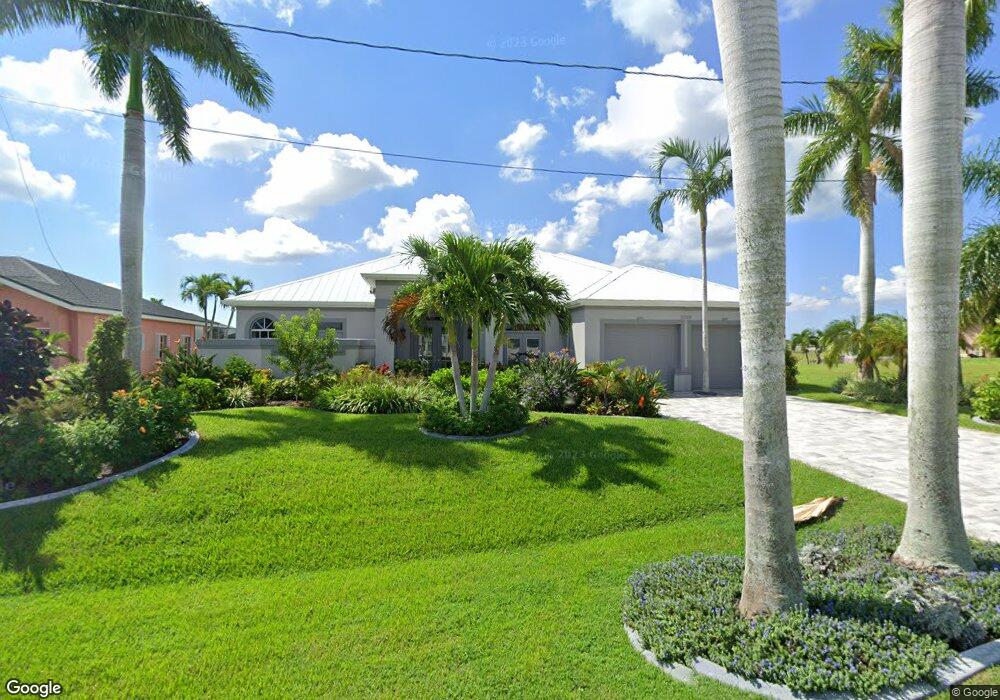
2020 SW 40th Terrace Cape Coral, FL 33914
Pelican NeighborhoodEstimated Value: $793,000 - $962,000
3
Beds
4
Baths
3,691
Sq Ft
$248/Sq Ft
Est. Value
About This Home
This home is located at 2020 SW 40th Terrace, Cape Coral, FL 33914 and is currently estimated at $913,579, approximately $247 per square foot. 2020 SW 40th Terrace is a home located in Lee County with nearby schools including Cape Elementary School, Caloosa Elementary School, and Tropic Isles Elementary School.
Ownership History
Date
Name
Owned For
Owner Type
Purchase Details
Closed on
Apr 8, 2009
Sold by
Aurora Loan Services Llc
Bought by
Dieperink Martin W and Diepernick Linda D
Current Estimated Value
Home Financials for this Owner
Home Financials are based on the most recent Mortgage that was taken out on this home.
Original Mortgage
$284,600
Interest Rate
5.18%
Mortgage Type
Unknown
Purchase Details
Closed on
Dec 22, 2008
Sold by
Voelker Patricia L
Bought by
Deutsche Bank Trust Company Americas
Purchase Details
Closed on
Jan 31, 2003
Sold by
Voelker Patricia L and Voelker Dan
Bought by
Voelker Patricia L and Voelker Dan
Purchase Details
Closed on
Sep 21, 1999
Sold by
Cusimano Francesco and Cusimano Maria C
Bought by
Voelker Patricia L
Purchase Details
Closed on
May 7, 1998
Sold by
B & S Ptnr
Bought by
Cusimano Francesco and Cusimano Maria C
Create a Home Valuation Report for This Property
The Home Valuation Report is an in-depth analysis detailing your home's value as well as a comparison with similar homes in the area
Home Values in the Area
Average Home Value in this Area
Purchase History
| Date | Buyer | Sale Price | Title Company |
|---|---|---|---|
| Dieperink Martin W | $355,750 | Landcastle Title Llc | |
| Aurora Loan Services Llc | -- | Landcastle Title Llc | |
| Deutsche Bank Trust Company Americas | -- | None Available | |
| Voelker Patricia L | -- | -- | |
| Voekler Patricia L | -- | -- | |
| Voelker Patricia L | $30,000 | -- | |
| Cusimano Francesco | $17,000 | -- |
Source: Public Records
Mortgage History
| Date | Status | Borrower | Loan Amount |
|---|---|---|---|
| Closed | Dieperink Martin W | $284,600 |
Source: Public Records
Tax History Compared to Growth
Tax History
| Year | Tax Paid | Tax Assessment Tax Assessment Total Assessment is a certain percentage of the fair market value that is determined by local assessors to be the total taxable value of land and additions on the property. | Land | Improvement |
|---|---|---|---|---|
| 2025 | $13,174 | $823,228 | -- | -- |
| 2024 | $13,295 | $748,389 | -- | -- |
| 2023 | $13,295 | $680,354 | $0 | $0 |
| 2022 | $11,950 | $618,504 | $0 | $0 |
| 2021 | $10,670 | $562,557 | $96,629 | $465,928 |
| 2020 | $10,420 | $511,160 | $70,500 | $440,660 |
| 2019 | $9,974 | $478,828 | $79,800 | $399,028 |
| 2018 | $10,293 | $482,903 | $76,000 | $406,903 |
| 2017 | $10,929 | $505,487 | $60,000 | $445,487 |
| 2016 | $10,280 | $462,789 | $76,379 | $386,410 |
| 2015 | $10,160 | $440,313 | $69,941 | $370,372 |
| 2014 | -- | $405,328 | $71,728 | $333,600 |
| 2013 | -- | $442,910 | $59,863 | $383,047 |
Source: Public Records
Map
Nearby Homes
- 3920 SW 20th Place
- 3917 Agualinda Blvd
- 3917 SW 20th Place
- 3916 SW 20th Place
- 2107 SW 39th St
- 4130 SW 21st Place
- 3821 SW 20th Place
- 3822 SW 20th Place
- 1910 SW 40th St
- 4122 SW 19th Ave
- 4126 SW 22nd Ct
- 2300 SW 39th Terrace
- 1823 SW 39th St Unit 70
- 4235 SW 20th Ave
- 1929 SW 38th St
- 2304 SW 38th Terrace
- 4311 SW 20th Ave
- 2019 SW 43rd Terrace
- 2301 SW 38th Terrace
- 1810 SW 42nd St
- 2026 SW 40th Terrace
- 4010 SW 20th Place
- 4011 SW 20th Place
- 2008 SW 40th Terrace
- 4006 SW 20th Place
- 2021 SW 41st St
- 2017 SW 41st St
- 2025 SW 41st St
- 4007 SW 20th Place
- 2013 SW 41st St
- 4007 Agualinda Blvd
- 4010 SW 20th Ave
- 2029 SW 41st St
- 2029 SW 41st St Unit 1
- 4003 SW 20th Place
- 2004 SW 40th Terrace
- 2009 SW 41st St
- 4003 Agualinda Blvd
- 4006 SW 20th Ave
- 2100 SW 40th Terrace