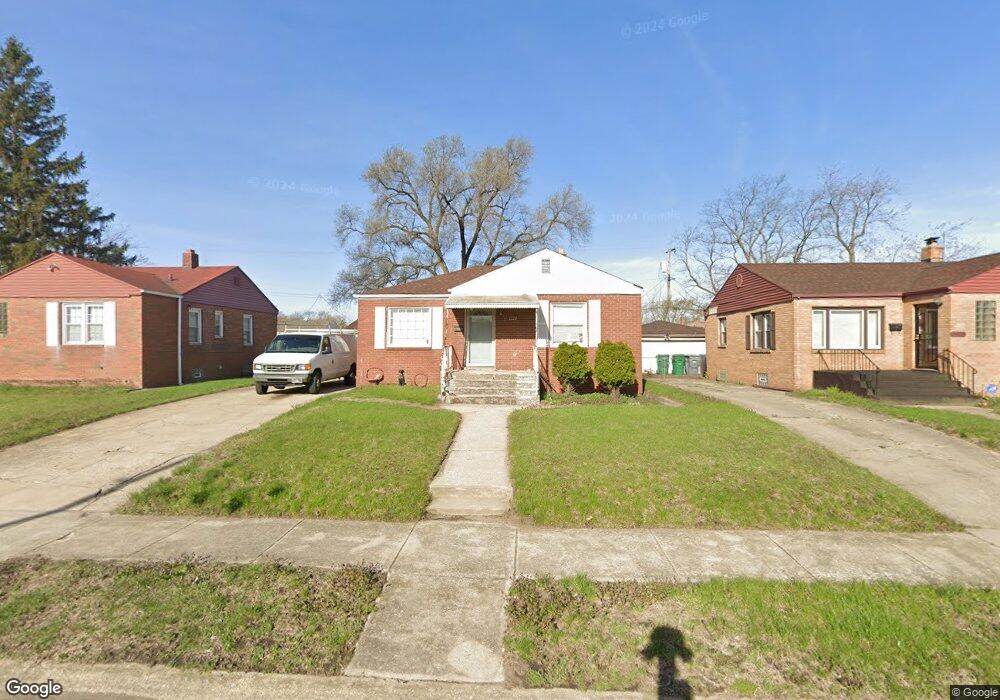
2020 Van Buren St Gary, IN 46407
Midtown NeighborhoodEstimated Value: $76,000 - $112,000
2
Beds
1
Bath
952
Sq Ft
$102/Sq Ft
Est. Value
About This Home
This home is located at 2020 Van Buren St, Gary, IN 46407 and is currently estimated at $96,683, approximately $101 per square foot. 2020 Van Buren St is a home located in Lake County with nearby schools including Beveridge Elementary School, Gary Middle School, and West Side Leadership Academy.
Ownership History
Date
Name
Owned For
Owner Type
Purchase Details
Closed on
Nov 4, 2011
Sold by
Isaiah Walton
Bought by
Tyler Errica
Current Estimated Value
Purchase Details
Closed on
Jul 18, 2007
Sold by
First Choice Investment Corp
Bought by
Walton Isaiah
Home Financials for this Owner
Home Financials are based on the most recent Mortgage that was taken out on this home.
Original Mortgage
$82,000
Interest Rate
6.73%
Mortgage Type
Seller Take Back
Purchase Details
Closed on
Dec 27, 2006
Sold by
Deutsche Bank National Trust Co
Bought by
First Choice Investment Corp
Home Financials for this Owner
Home Financials are based on the most recent Mortgage that was taken out on this home.
Original Mortgage
$54,500
Interest Rate
6.19%
Mortgage Type
Purchase Money Mortgage
Purchase Details
Closed on
Jun 2, 2006
Sold by
Matthews Sarah
Bought by
Deutsche Bank National Trust Co and New Century Home Equity Loan Trust Serie
Create a Home Valuation Report for This Property
The Home Valuation Report is an in-depth analysis detailing your home's value as well as a comparison with similar homes in the area
Home Values in the Area
Average Home Value in this Area
Purchase History
| Date | Buyer | Sale Price | Title Company |
|---|---|---|---|
| Tyler Errica | $2,500 | None Available | |
| Walton Isaiah | -- | None Available | |
| First Choice Investment Corp | -- | Prism Title & Closing Servic | |
| Deutsche Bank National Trust Co | $62,097 | None Available |
Source: Public Records
Mortgage History
| Date | Status | Borrower | Loan Amount |
|---|---|---|---|
| Previous Owner | Walton Isaiah | $82,000 | |
| Previous Owner | First Choice Investment Corp | $54,500 |
Source: Public Records
Tax History Compared to Growth
Tax History
| Year | Tax Paid | Tax Assessment Tax Assessment Total Assessment is a certain percentage of the fair market value that is determined by local assessors to be the total taxable value of land and additions on the property. | Land | Improvement |
|---|---|---|---|---|
| 2024 | $6,084 | $71,500 | $7,200 | $64,300 |
| 2023 | $780 | $69,000 | $7,600 | $61,400 |
| 2022 | $780 | $67,400 | $6,400 | $61,000 |
| 2021 | $724 | $62,500 | $6,400 | $56,100 |
| 2020 | $702 | $60,600 | $6,400 | $54,200 |
| 2019 | $672 | $60,600 | $6,400 | $54,200 |
| 2018 | $802 | $60,600 | $6,400 | $54,200 |
| 2017 | $704 | $61,200 | $6,400 | $54,800 |
| 2016 | $725 | $63,700 | $6,400 | $57,300 |
| 2014 | $780 | $71,000 | $7,000 | $64,000 |
| 2013 | $771 | $71,800 | $7,000 | $64,800 |
Source: Public Records
Map
Nearby Homes
- 2049 Monroe Ln
- 724 W 19th Ave
- 1957 Madison Ln
- 1014 W 19th Ave
- 1273 - 1277 W 17th Ave
- 1201 W 21st Ave
- 1209 W 21st Ave
- 1545 Van Buren St
- 555 W 22nd Place
- 1384 Harrison St
- 1241 W 17th Ave
- 1297 W 17th Ave
- 1330 Van Buren St
- 2348 Pierce St
- 1418 W 16th Ave
- 2401 Fillmore St
- 1971 Massachusetts St
- 1165 Harrison St
- 1148 Jackson St
- 1752 Hayes St
- 2014 Van Buren St
- 2036 Van Buren St
- 2006 Van Buren St
- 2042 Van Buren St
- 2015 Harrison St
- 2021 Harrison St
- 2007 Harrison St
- 2035 Harrison St
- 2021 Van Buren St
- 2029 Van Buren St
- 2000 Van Buren St
- 2015 Van Buren St
- 2048 Van Buren St
- 2001 Harrison St
- 2007 Van Buren St
- 2043 Harrison St
- 638 W 20th Place
- 29 Van Buren St
- 1982 Van Buren St
- 2054 Van Buren St