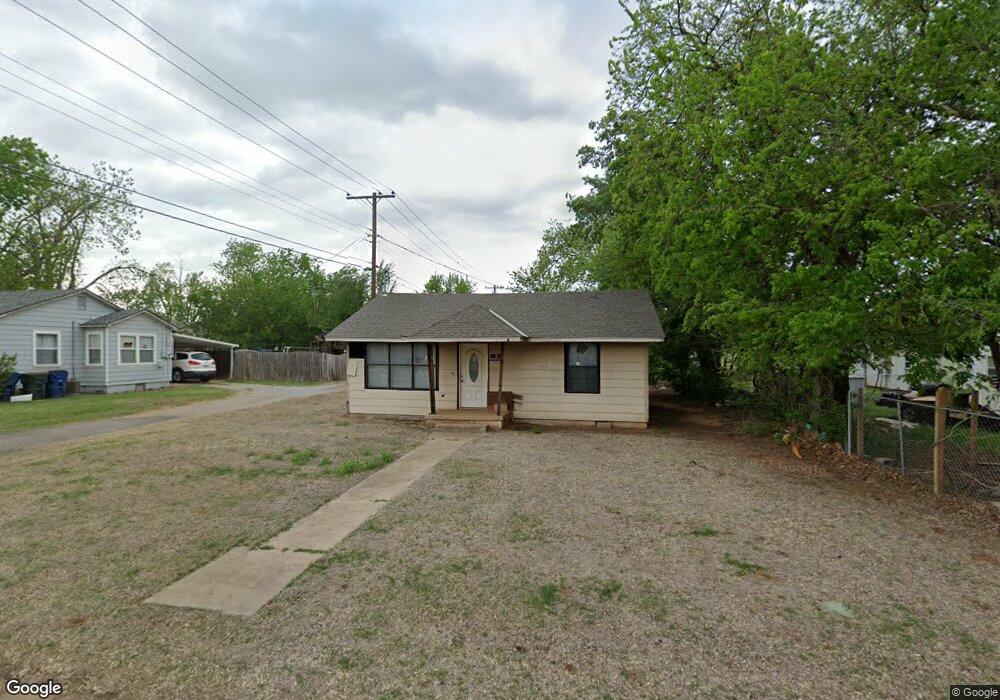
2020 W Nevada Ave Chickasha, OK 73018
Estimated Value: $104,344 - $126,000
3
Beds
1
Bath
1,379
Sq Ft
$83/Sq Ft
Est. Value
About This Home
This home is located at 2020 W Nevada Ave, Chickasha, OK 73018 and is currently estimated at $114,836, approximately $83 per square foot. 2020 W Nevada Ave is a home located in Grady County with nearby schools including Grand Avenue Elementary School, Chickasha Middle School, and Lincoln Elementary School.
Ownership History
Date
Name
Owned For
Owner Type
Purchase Details
Closed on
Sep 27, 2011
Sold by
Beene Alvin A and Beene Patsy
Bought by
Garcia Dora E
Current Estimated Value
Home Financials for this Owner
Home Financials are based on the most recent Mortgage that was taken out on this home.
Original Mortgage
$42,751
Outstanding Balance
$4,077
Interest Rate
4.24%
Mortgage Type
New Conventional
Estimated Equity
$110,759
Purchase Details
Closed on
Aug 5, 2008
Sold by
Secretary Of Hud
Bought by
Beene Alvin A and Beene Patsy
Purchase Details
Closed on
Feb 15, 2008
Sold by
Jay Erica D
Bought by
Secretary Of Hud
Purchase Details
Closed on
Jan 4, 2006
Sold by
Blalock David W and Blalock Donna S
Bought by
Jay Erica D
Home Financials for this Owner
Home Financials are based on the most recent Mortgage that was taken out on this home.
Original Mortgage
$59,430
Interest Rate
6.23%
Mortgage Type
FHA
Create a Home Valuation Report for This Property
The Home Valuation Report is an in-depth analysis detailing your home's value as well as a comparison with similar homes in the area
Home Values in the Area
Average Home Value in this Area
Purchase History
| Date | Buyer | Sale Price | Title Company |
|---|---|---|---|
| Garcia Dora E | $56,333 | The Okshoma City Abstract & | |
| Beene Alvin A | -- | None Available | |
| Secretary Of Hud | -- | None Available | |
| Jay Erica D | $60,000 | None Available |
Source: Public Records
Mortgage History
| Date | Status | Borrower | Loan Amount |
|---|---|---|---|
| Open | Garcia Dora E | $42,751 | |
| Previous Owner | Jay Erica D | $59,430 |
Source: Public Records
Tax History Compared to Growth
Tax History
| Year | Tax Paid | Tax Assessment Tax Assessment Total Assessment is a certain percentage of the fair market value that is determined by local assessors to be the total taxable value of land and additions on the property. | Land | Improvement |
|---|---|---|---|---|
| 2024 | $469 | $6,624 | $936 | $5,688 |
| 2023 | $469 | $6,431 | $1,037 | $5,394 |
| 2022 | $441 | $6,244 | $739 | $5,505 |
| 2021 | $448 | $6,457 | $739 | $5,718 |
| 2020 | $584 | $6,674 | $739 | $5,935 |
| 2019 | $580 | $6,744 | $739 | $6,005 |
| 2018 | $598 | $6,807 | $739 | $6,068 |
| 2017 | $581 | $6,608 | $739 | $5,869 |
| 2016 | $618 | $6,924 | $739 | $6,185 |
| 2015 | $643 | $6,808 | $739 | $6,069 |
| 2014 | $643 | $7,138 | $739 | $6,399 |
Source: Public Records
Map
Nearby Homes
- 1624 S 19th St
- 1508 S 19th St
- 2002 S 20th St
- 2203 W Georgia Ave
- 2500 W Grand Ave
- 1127 S 19th St
- 1124 S 19th St
- 2501 W Georgia Ave
- 112 Mockingbird Ln
- 1928 Arizona Ave
- 1707 California Ave
- 1402 S 14th St
- 1028 S 16th St
- 1002 Tarry Town Dr
- 0 S 13th St
- 2830 W Georgia Ave
- 2628 S 19th St
- 2615 S 18th St
- 0 S 12th St
- 2325 S 28th Terrace
- 2028 W Nevada Ave
- 2012 W Nevada Ave
- 1709 S 21st St
- 1728 S 20th St
- 1724 S 20th St
- 1716 S 20th St
- 1705 S 21st St
- 1802 S 20th St
- 2019 W Alabama Ave
- 1704 S 20th St
- 2027 W Alabama Ave
- 1804 S 20th St
- 1726 S 21st St
- 1718 S 21st St
- 1702 S 20th St
- 1714 S 21st St
- 1814 S 20th St
- 1809 S 21st St
- 1802 S 21st St
- 1717 S 20th St