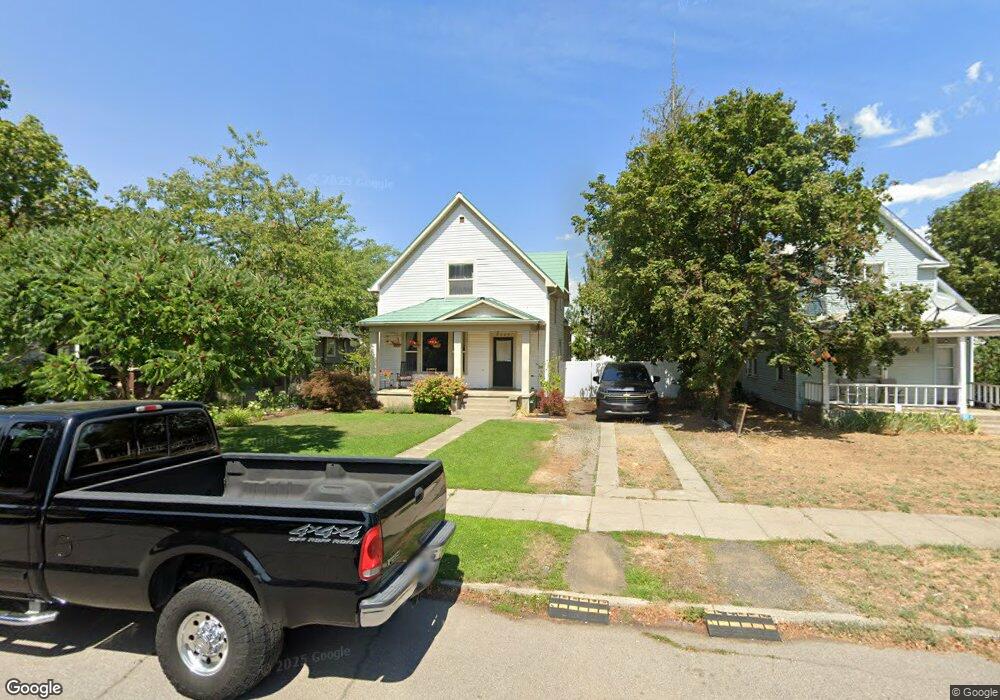
2020 W Sharp Ave Spokane, WA 99201
West Central NeighborhoodEstimated Value: $348,000 - $404,000
4
Beds
2
Baths
2,100
Sq Ft
$178/Sq Ft
Est. Value
About This Home
This home is located at 2020 W Sharp Ave, Spokane, WA 99201 and is currently estimated at $372,786, approximately $177 per square foot. 2020 W Sharp Ave is a home located in Spokane County with nearby schools including Holmes Elementary School, North Central High School, and Glover Middle School.
Ownership History
Date
Name
Owned For
Owner Type
Purchase Details
Closed on
Oct 15, 2020
Sold by
Saludes Yolanda R and Saludes Albert J
Bought by
Saludes Adrian and Saludes Sara Jubilee
Current Estimated Value
Purchase Details
Closed on
May 22, 2017
Sold by
Vancil Jonathan J and Vancil Katherine A
Bought by
Saludes Albert J and Saludes Yolanda
Purchase Details
Closed on
Aug 17, 2012
Sold by
Kolbo Scott M and Kolbo Julie L
Bought by
Vancil Jonathan J and Vancil Katherine A
Home Financials for this Owner
Home Financials are based on the most recent Mortgage that was taken out on this home.
Original Mortgage
$118,695
Interest Rate
3.37%
Mortgage Type
FHA
Purchase Details
Closed on
May 10, 2004
Sold by
Roberts John M
Bought by
Kolbo Scott M and Kolbo Julie K
Home Financials for this Owner
Home Financials are based on the most recent Mortgage that was taken out on this home.
Original Mortgage
$83,600
Interest Rate
5.5%
Mortgage Type
Purchase Money Mortgage
Create a Home Valuation Report for This Property
The Home Valuation Report is an in-depth analysis detailing your home's value as well as a comparison with similar homes in the area
Home Values in the Area
Average Home Value in this Area
Purchase History
| Date | Buyer | Sale Price | Title Company |
|---|---|---|---|
| Saludes Adrian | -- | None Listed On Document | |
| Saludes Albert J | -- | First American Title Ins Co | |
| Vancil Jonathan J | $123,280 | Inland Professional Title Ll | |
| Kolbo Scott M | $88,000 | Transnation Title |
Source: Public Records
Mortgage History
| Date | Status | Borrower | Loan Amount |
|---|---|---|---|
| Previous Owner | Vancil Jonathan J | $118,695 | |
| Previous Owner | Kolbo Scott M | $83,600 |
Source: Public Records
Tax History
| Year | Tax Paid | Tax Assessment Tax Assessment Total Assessment is a certain percentage of the fair market value that is determined by local assessors to be the total taxable value of land and additions on the property. | Land | Improvement |
|---|---|---|---|---|
| 2025 | $3,396 | $354,300 | $90,000 | $264,300 |
| 2024 | $3,396 | $342,100 | $80,000 | $262,100 |
| 2023 | $3,225 | $346,000 | $65,000 | $281,000 |
| 2022 | $2,648 | $329,500 | $65,000 | $264,500 |
| 2021 | $2,317 | $194,500 | $23,000 | $171,500 |
| 2020 | $2,080 | $168,100 | $18,000 | $150,100 |
| 2019 | $1,797 | $150,100 | $18,000 | $132,100 |
| 2018 | $1,656 | $118,800 | $18,000 | $100,800 |
| 2017 | $1,408 | $102,800 | $18,000 | $84,800 |
| 2016 | $1,464 | $104,600 | $18,000 | $86,600 |
| 2015 | $1,496 | $104,600 | $18,000 | $86,600 |
| 2014 | -- | $115,300 | $20,000 | $95,300 |
| 2013 | -- | $0 | $0 | $0 |
Source: Public Records
Map
Nearby Homes
- 1928 W Sharp Ave
- 1824 W Sharp Ave
- 2016 W Gardner Ave
- 2211 W Sinto Ave
- 1904 W Gardner Ave
- 2224 W Boone Ave
- 1824 & 1830 W Maxwell Ave
- 1830 W Maxwell Ave
- 1215 N Nettleton St Unit 2301 W Sharp Ave
- 1824 W Maxwell Ave
- 2316 W Sinto Ave
- 2221 W Mission Ave
- 1813 W Mission Ave
- 1801 W Gardner Ave
- 2024 W Spofford Ave
- 2216 W Dean Ave
- 2115 W Dean Ave
- 1722 W Dean Ave
- 2003 W Mallon Ave
- 1913 W Mallon Ave
- 2024 W Sharp Ave
- 2014 W Sharp Ave
- 2028 W Sharp Ave
- 2008 W Sharp Ave
- 1320 N Belt St
- 2004 W Sharp Ave
- 2017 W Sinto Ave
- 2011 W Sinto Ave
- 2017 W Sharp Ave
- 2038 W Sharp Ave
- 1328 N Belt St
- 2007 W Sinto Ave
- 2023 W Sharp Ave
- 2011 W Sharp Ave
- 1327 N Cannon St
- 2027 W Sharp Ave
- 2007 W Sharp Ave
- 2039 W Sharp Ave
- 2003 W Sharp Ave
- 2039 W Sinto Ave
Your Personal Tour Guide
Ask me questions while you tour the home.