2020 Ward Rd Columbus, OH 43224
North Linden NeighborhoodEstimated Value: $200,983 - $227,000
3
Beds
2
Baths
1,120
Sq Ft
$194/Sq Ft
Est. Value
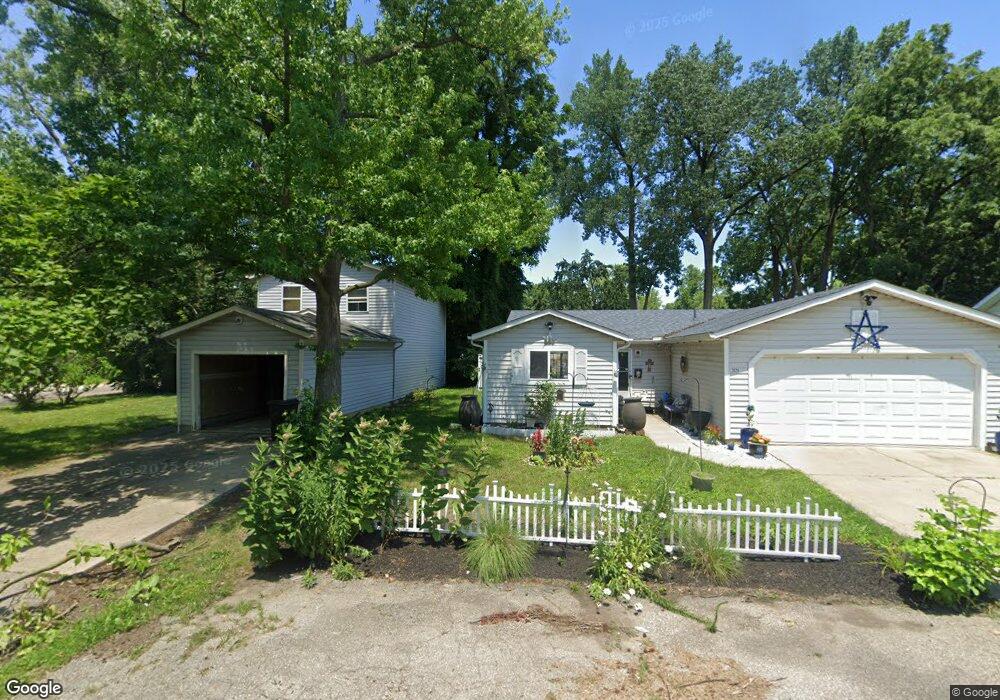
About This Home
This home is located at 2020 Ward Rd, Columbus, OH 43224 and is currently estimated at $217,746, approximately $194 per square foot. 2020 Ward Rd is a home located in Franklin County with nearby schools including North Linden Elementary School, Medina Middle School, and Mifflin High School.
Ownership History
Date
Name
Owned For
Owner Type
Purchase Details
Closed on
May 27, 2020
Sold by
Betton Alivia C
Bought by
Williams Alivia C and Williams Timothy
Current Estimated Value
Purchase Details
Closed on
Nov 26, 1996
Sold by
Neale Hershel
Bought by
Alivia C Betton
Home Financials for this Owner
Home Financials are based on the most recent Mortgage that was taken out on this home.
Original Mortgage
$74,800
Interest Rate
7.94%
Mortgage Type
New Conventional
Create a Home Valuation Report for This Property
The Home Valuation Report is an in-depth analysis detailing your home's value as well as a comparison with similar homes in the area
Home Values in the Area
Average Home Value in this Area
Purchase History
| Date | Buyer | Sale Price | Title Company |
|---|---|---|---|
| Williams Alivia C | -- | None Available | |
| Alivia C Betton | $74,900 | -- |
Source: Public Records
Mortgage History
| Date | Status | Borrower | Loan Amount |
|---|---|---|---|
| Previous Owner | Alivia C Betton | $74,800 |
Source: Public Records
Tax History Compared to Growth
Tax History
| Year | Tax Paid | Tax Assessment Tax Assessment Total Assessment is a certain percentage of the fair market value that is determined by local assessors to be the total taxable value of land and additions on the property. | Land | Improvement |
|---|---|---|---|---|
| 2024 | $3,156 | $54,640 | $8,400 | $46,240 |
| 2023 | $3,122 | $54,635 | $8,400 | $46,235 |
| 2022 | $2,108 | $28,950 | $5,150 | $23,800 |
| 2021 | $2,111 | $28,950 | $5,150 | $23,800 |
| 2020 | $2,161 | $28,950 | $5,150 | $23,800 |
| 2019 | $1,842 | $22,790 | $4,100 | $18,690 |
| 2018 | $1,961 | $22,790 | $4,100 | $18,690 |
| 2017 | $2,109 | $22,790 | $4,100 | $18,690 |
| 2016 | $2,378 | $26,610 | $3,330 | $23,280 |
| 2015 | $2,083 | $26,610 | $3,330 | $23,280 |
| 2014 | $2,086 | $26,610 | $3,330 | $23,280 |
| 2013 | $1,137 | $29,540 | $3,675 | $25,865 |
Source: Public Records
Map
Nearby Homes
- 4111 Walford St
- 1997 Ferris Rd
- 2023 Ferris Rd
- 1936 Case Rd
- 1863 Ward Rd
- 4217 Hickman Rd
- 1896 Ormond Ave
- 2194 Ashley Dr
- 2144 Colfax Ave
- 2220 Sale Rd
- 4309 Walford St
- 2219 Sale Rd
- 2283 Ward Rd
- 1734 Ferris Rd
- 2015 Melrose Ave
- 3685 Cleveland Ave
- 4090 Cleveland Ave
- 3750 Dresden St
- 4057 Estates Place
- 1905 Elmore Ave