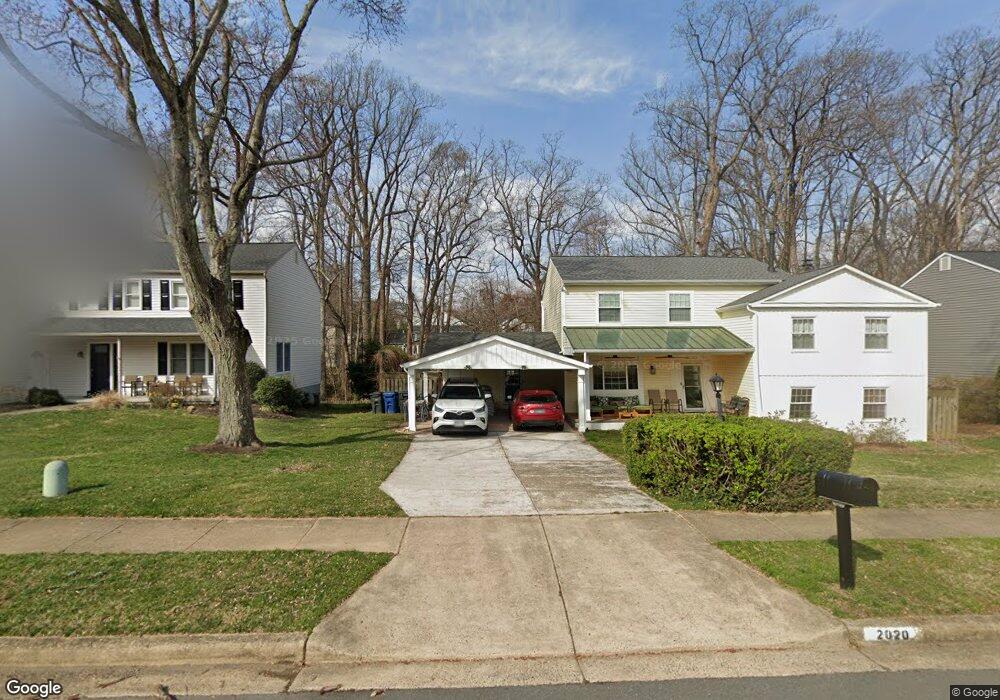
2020 Wellfleet Ct Falls Church, VA 22043
Estimated Value: $1,207,000 - $1,512,000
3
Beds
3
Baths
2,146
Sq Ft
$621/Sq Ft
Est. Value
About This Home
This home is located at 2020 Wellfleet Ct, Falls Church, VA 22043 and is currently estimated at $1,331,633, approximately $620 per square foot. 2020 Wellfleet Ct is a home located in Fairfax County with nearby schools including Haycock Elementary School, Longfellow Middle School, and Saint John the Beloved Academy.
Ownership History
Date
Name
Owned For
Owner Type
Purchase Details
Closed on
Sep 17, 2014
Sold by
Moore Christopher C and Moore Sang H
Bought by
Moore Christopher C and Moore Sang H
Current Estimated Value
Purchase Details
Closed on
May 7, 2010
Sold by
Gelven Joseph W
Bought by
Moore Christopher C
Home Financials for this Owner
Home Financials are based on the most recent Mortgage that was taken out on this home.
Original Mortgage
$520,000
Interest Rate
5.03%
Mortgage Type
New Conventional
Create a Home Valuation Report for This Property
The Home Valuation Report is an in-depth analysis detailing your home's value as well as a comparison with similar homes in the area
Home Values in the Area
Average Home Value in this Area
Purchase History
| Date | Buyer | Sale Price | Title Company |
|---|---|---|---|
| Moore Christopher C | -- | -- | |
| Moore Christopher C | $650,000 | -- |
Source: Public Records
Mortgage History
| Date | Status | Borrower | Loan Amount |
|---|---|---|---|
| Previous Owner | Moore Christopher C | $520,000 |
Source: Public Records
Tax History Compared to Growth
Tax History
| Year | Tax Paid | Tax Assessment Tax Assessment Total Assessment is a certain percentage of the fair market value that is determined by local assessors to be the total taxable value of land and additions on the property. | Land | Improvement |
|---|---|---|---|---|
| 2025 | $13,056 | $1,149,490 | $581,000 | $568,490 |
| 2024 | $13,056 | $1,058,060 | $570,000 | $488,060 |
| 2023 | $12,789 | $1,068,090 | $570,000 | $498,090 |
| 2022 | $11,240 | $922,830 | $475,000 | $447,830 |
| 2021 | $10,781 | $867,630 | $452,000 | $415,630 |
| 2020 | $10,993 | $880,490 | $452,000 | $428,490 |
| 2019 | $10,020 | $798,610 | $452,000 | $346,610 |
| 2018 | $8,872 | $771,510 | $435,000 | $336,510 |
| 2017 | $9,480 | $771,510 | $435,000 | $336,510 |
| 2016 | $9,382 | $764,910 | $435,000 | $329,910 |
| 2015 | $8,800 | $742,300 | $422,000 | $320,300 |
| 2014 | $8,481 | $715,840 | $410,000 | $305,840 |
Source: Public Records
Map
Nearby Homes
- 6607 Midhill Place
- 6609 Rockmont Ct
- 6545 Placid St
- 6610 Quinten St
- 2005 Highboro Way
- 2125 Hilltop Place
- 6616 Kirby Ct
- 6449 Orland St
- 2115 Natahoa Ct
- 6511 Ivy Hill Dr
- 2123 Natahoa Ct
- 1904 Lamson Place
- 2107 Elliott Ave
- 2221 Orchid Dr
- 2136 Powhatan St
- 2231 N Tuckahoe St
- 6616 Fisher Ave
- 6613 Fisher Ave
- 6601 Gordon Ave
- 6528 36th St N
- 2022 Wellfleet Ct
- 2018 Wellfleet Ct
- 2024 Wellfleet Ct
- 2019 Wellfleet Ct
- 2016 Wellfleet Ct
- 2021 Wellfleet Ct
- 2017 Wellfleet Ct
- 2023 Wellfleet Ct
- 2015 Wellfleet Ct
- 2026 Wellfleet Ct
- 2014 Wellfleet Ct
- 2043 Haycock Rd
- 2045 Haycock Rd
- 6513 Shipyard Place
- 6514 Cape Ct
- 2025 Wellfleet Ct
- 2028 Wellfleet Ct
- 2020 Freedom Ln
- 2047 Haycock Rd
- 2041 Haycock Rd