Estimated Value: $163,000 - $192,000
3
Beds
2
Baths
1,152
Sq Ft
$152/Sq Ft
Est. Value
About This Home
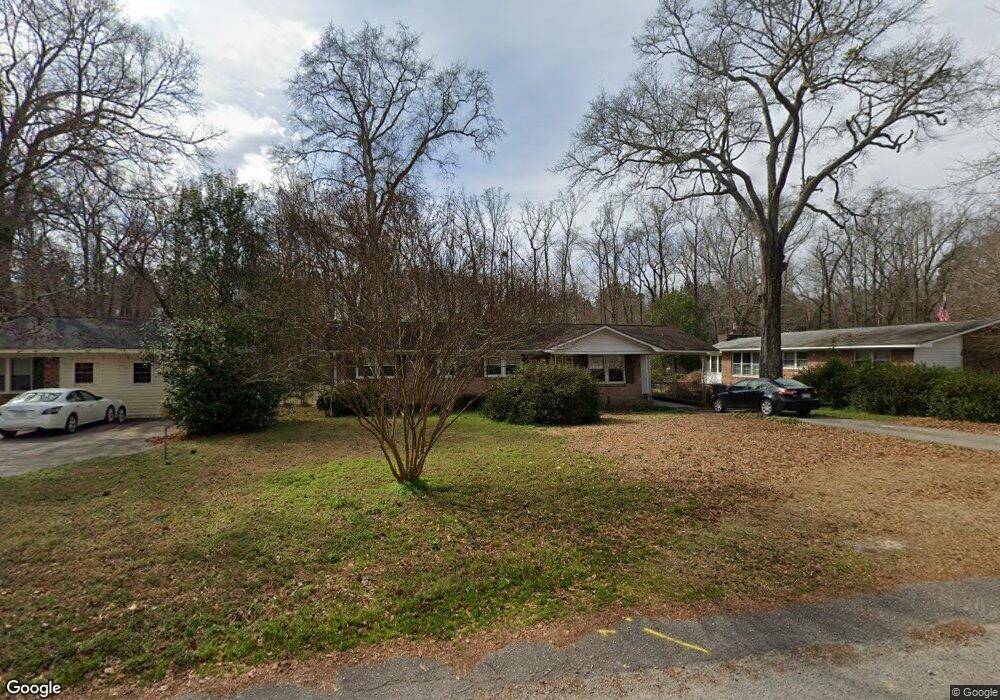
This home is located at 2020 Windsor Dr, Cayce, SC 29033 and is currently estimated at $175,441, approximately $152 per square foot. 2020 Windsor Dr is a home located in Lexington County with nearby schools including Springdale Elementary School, R. H. Fulmer Middle, and Airport High School.
Ownership History
Date
Name
Owned For
Owner Type
Purchase Details
Closed on
Apr 3, 2018
Sold by
Kaiser Ellen Reddick
Bought by
Kaiser Ellen Reddick and Kaiser Drake H
Current Estimated Value
Home Financials for this Owner
Home Financials are based on the most recent Mortgage that was taken out on this home.
Original Mortgage
$81,196
Outstanding Balance
$69,713
Interest Rate
4.37%
Mortgage Type
FHA
Estimated Equity
$105,728
Purchase Details
Closed on
Jul 24, 2006
Sold by
Hammond Amie R
Bought by
Miller E Hite and Miller Annette L
Purchase Details
Closed on
Jun 19, 2003
Sold by
Weeks Lewis W
Bought by
Mulder John K
Purchase Details
Closed on
May 30, 2003
Sold by
Poehner William J
Bought by
Hammond Amie R
Purchase Details
Closed on
Aug 30, 2002
Sold by
Springer Jon C
Bought by
Coble H Steven
Purchase Details
Closed on
Sep 21, 1998
Sold by
Ferez Ana M
Bought by
Benson Angela L
Create a Home Valuation Report for This Property
The Home Valuation Report is an in-depth analysis detailing your home's value as well as a comparison with similar homes in the area
Home Values in the Area
Average Home Value in this Area
Purchase History
| Date | Buyer | Sale Price | Title Company |
|---|---|---|---|
| Kaiser Ellen Reddick | -- | None Available | |
| Kaiser Ellen Reddick | $84,000 | None Available | |
| Miller E Hite | $95,000 | None Available | |
| Mulder John K | $132,500 | -- | |
| Hammond Amie R | $83,888 | -- | |
| Coble H Steven | $146,000 | -- | |
| Benson Angela L | $69,900 | -- |
Source: Public Records
Mortgage History
| Date | Status | Borrower | Loan Amount |
|---|---|---|---|
| Open | Kaiser Ellen Reddick | $81,196 |
Source: Public Records
Tax History Compared to Growth
Tax History
| Year | Tax Paid | Tax Assessment Tax Assessment Total Assessment is a certain percentage of the fair market value that is determined by local assessors to be the total taxable value of land and additions on the property. | Land | Improvement |
|---|---|---|---|---|
| 2024 | $621 | $3,435 | $720 | $2,715 |
| 2023 | $621 | $3,435 | $720 | $2,715 |
| 2022 | $613 | $3,435 | $720 | $2,715 |
| 2020 | $598 | $3,435 | $720 | $2,715 |
| 2019 | $596 | $3,360 | $720 | $2,640 |
| 2018 | $1,606 | $4,732 | $1,080 | $3,652 |
| 2017 | $1,581 | $4,732 | $1,080 | $3,652 |
| 2016 | $1,590 | $4,732 | $1,080 | $3,652 |
| 2014 | $1,423 | $4,928 | $828 | $4,100 |
| 2013 | -- | $4,930 | $830 | $4,100 |
Source: Public Records
Map
Nearby Homes
- 2012 Windsor Dr
- 2109 Sheffield Ln
- 601 Picadilly Square
- 2107 Durham Dr
- 2093 Durham Dr
- 2109 Durham Dr
- 2032 Pinewood St
- 2311 Congaree Dr
- 1112 Pine Croft Dr
- 2113 Axson St
- 3027 Platt Springs Rd
- 1023 Wisteria Dr
- TBD Woodfield Jupiter & Daisey Track
- 1049 Wisteria Dr
- 1211 Decatur St
- 910 Pond Dr
- 826 Jefferson St
- 1210 Decatur St
- 1000 Hampton Crest Dr
- 1832 Wadsworth Dr
- 2016 Windsor Dr
- 2024 Windsor Dr
- 2028 Windsor Dr
- 2025 Windsor Rd
- 2025 Windsor Dr
- 2037 Windsor Dr
- 2017 Windsor Dr
- 2021 Windsor Dr
- 2013 Windsor Dr
- 2009 Windsor Dr
- 2024 Wellington Rd
- 2308 Marlboro Rd
- 2020 Wellington Rd
- 2005 Windsor Dr
- 2025 Wellington Rd
- 2016 Wellington Rd
- 2001 Windsor Dr
- 2302 Marlboro Rd
- 2012 Wellington Rd
- 2021 Wellington Rd