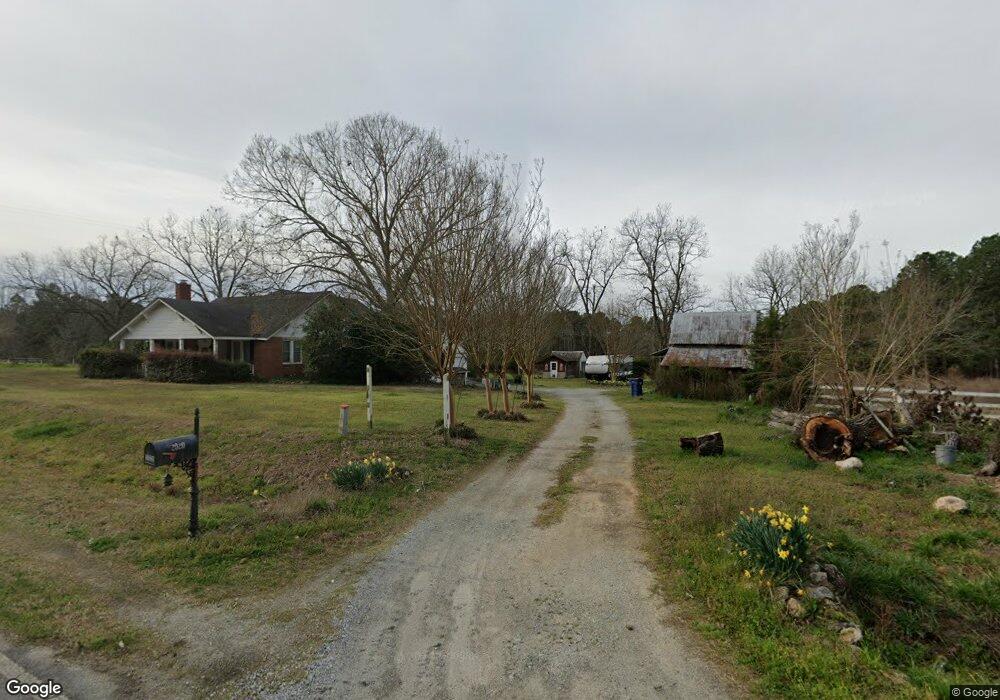
2020 Wire Rd Thomson, GA 30824
Estimated Value: $427,000 - $513,000
4
Beds
4
Baths
3,264
Sq Ft
$142/Sq Ft
Est. Value
About This Home
This home is located at 2020 Wire Rd, Thomson, GA 30824 and is currently estimated at $464,742, approximately $142 per square foot. 2020 Wire Rd is a home located in McDuffie County with nearby schools including Thomson High School.
Ownership History
Date
Name
Owned For
Owner Type
Purchase Details
Closed on
Feb 14, 2020
Sold by
Newell Harry G
Bought by
Bruce Joshua N and Kirkpatrick Bruce Christiana
Current Estimated Value
Home Financials for this Owner
Home Financials are based on the most recent Mortgage that was taken out on this home.
Original Mortgage
$369,900
Outstanding Balance
$326,120
Interest Rate
3.6%
Mortgage Type
VA
Estimated Equity
$138,622
Purchase Details
Closed on
Oct 14, 2008
Sold by
Federal Home Loan Mortgage Corporation
Bought by
Newell Harry G and Newell Rosemary D
Purchase Details
Closed on
Jun 3, 2008
Sold by
Chase Home Finance Llc
Bought by
Federal Home Loan Mortgage Corporation
Purchase Details
Closed on
Sep 24, 2004
Sold by
Mayo Christopher L
Bought by
Smith Thomas P
Purchase Details
Closed on
Mar 30, 2000
Sold by
Hulsey Richard
Bought by
Mayo Christopher L
Purchase Details
Closed on
Oct 12, 1995
Sold by
Liggins Maynola H
Bought by
Hulsey Richard
Purchase Details
Closed on
Aug 8, 1994
Bought by
Liggins Maynola H
Create a Home Valuation Report for This Property
The Home Valuation Report is an in-depth analysis detailing your home's value as well as a comparison with similar homes in the area
Home Values in the Area
Average Home Value in this Area
Purchase History
| Date | Buyer | Sale Price | Title Company |
|---|---|---|---|
| Bruce Joshua N | $369,900 | -- | |
| Newell Harry G | $142,900 | -- | |
| Federal Home Loan Mortgage Corporation | $187,272 | -- | |
| Chase Home Finance Llc | $187,272 | -- | |
| Smith Thomas P | $197,500 | -- | |
| Mayo Christopher L | $140,500 | -- | |
| Hulsey Richard | $75,000 | -- | |
| Liggins Maynola H | $74,000 | -- |
Source: Public Records
Mortgage History
| Date | Status | Borrower | Loan Amount |
|---|---|---|---|
| Open | Bruce Joshua N | $369,900 |
Source: Public Records
Tax History
| Year | Tax Paid | Tax Assessment Tax Assessment Total Assessment is a certain percentage of the fair market value that is determined by local assessors to be the total taxable value of land and additions on the property. | Land | Improvement |
|---|---|---|---|---|
| 2025 | $3,912 | $161,346 | $26,343 | $135,003 |
| 2024 | $3,912 | $152,133 | $23,732 | $128,401 |
| 2023 | $3,750 | $146,832 | $23,732 | $123,100 |
| 2022 | $4,275 | $159,426 | $23,732 | $135,694 |
| 2021 | $3,047 | $129,615 | $23,041 | $106,574 |
| 2020 | $1,701 | $101,506 | $21,684 | $79,822 |
| 2019 | $1,453 | $92,050 | $21,684 | $70,366 |
| 2018 | $1,450 | $92,050 | $21,684 | $70,366 |
| 2017 | $1,378 | $92,050 | $21,684 | $70,366 |
| 2016 | $1,885 | $91,779 | $21,684 | $70,095 |
| 2015 | $1,713 | $91,272 | $21,177 | $70,095 |
| 2014 | $1,717 | $91,272 | $21,177 | $70,095 |
| 2013 | -- | $91,272 | $21,176 | $70,095 |
Source: Public Records
Map
Nearby Homes
- 1690 Wrens Hwy
- 1964 Wrens Hwy
- 789 George McDuffie Rd
- 1543 Wrens Hwy
- 000 Wrens Hwy
- 0 Wrens Hwy Unit 10652460
- 0 Wrens Hwy Unit 549833
- 1451 Central Road Extension
- 118 Langham St
- 306 Michael St
- 354 King St
- 609 Dell Dr
- 67 Shadowmoor Cir
- 462 Bussey Ave
- 609 Hillcrest Dr
- 421 Salem Rd
- 426 Salem Rd
- 509 Fluker St
- 410 Johns Rd
- 1009 Berkley Ct W
Your Personal Tour Guide
Ask me questions while you tour the home.