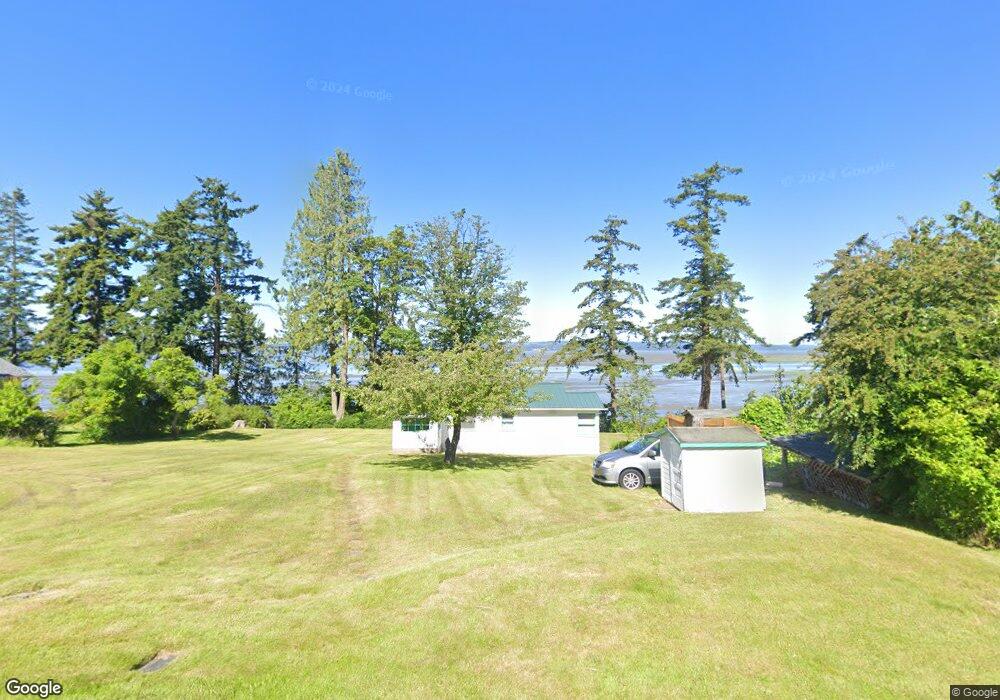
20202 Beach Dr Stanwood, WA 98292
Warm Beach NeighborhoodEstimated Value: $758,000 - $1,004,000
1
Bed
1
Bath
657
Sq Ft
$1,340/Sq Ft
Est. Value
About This Home
This home is located at 20202 Beach Dr, Stanwood, WA 98292 and is currently estimated at $880,108, approximately $1,339 per square foot. 20202 Beach Dr is a home with nearby schools including Stanwood Elementary School, Port Susan Middle School, and Stanwood High School.
Ownership History
Date
Name
Owned For
Owner Type
Purchase Details
Closed on
May 29, 2019
Sold by
Watson Robert John and Watson Patricia Ruth
Bought by
Riley Shirley Jean
Current Estimated Value
Purchase Details
Closed on
Aug 8, 2014
Sold by
Roening Mary Louise
Bought by
Roening Donald W and Joint Mary L Roening
Purchase Details
Closed on
Aug 14, 2012
Sold by
Watson James William and Watson Lanora Christina
Bought by
Roening Mary Louise
Purchase Details
Closed on
Feb 22, 2012
Sold by
Watson Ronald George
Bought by
Riley Shirley Jean
Purchase Details
Closed on
Mar 19, 2004
Sold by
Watson Robert John and Watson Patricia R
Bought by
Watson Robert J and Riley Shirley Jean
Purchase Details
Closed on
May 2, 2002
Sold by
Watson Frederick Wm
Bought by
Watson Ronald George and Watson Jennifer Amy
Create a Home Valuation Report for This Property
The Home Valuation Report is an in-depth analysis detailing your home's value as well as a comparison with similar homes in the area
Home Values in the Area
Average Home Value in this Area
Purchase History
| Date | Buyer | Sale Price | Title Company |
|---|---|---|---|
| Riley Shirley Jean | -- | None Available | |
| Roening Donald W | -- | None Available | |
| Roening Mary Louise | -- | None Available | |
| Riley Shirley Jean | -- | None Available | |
| Watson Robert J | -- | Chicago | |
| Watson Ronald George | -- | -- |
Source: Public Records
Tax History Compared to Growth
Tax History
| Year | Tax Paid | Tax Assessment Tax Assessment Total Assessment is a certain percentage of the fair market value that is determined by local assessors to be the total taxable value of land and additions on the property. | Land | Improvement |
|---|---|---|---|---|
| 2025 | $6,669 | $886,700 | $812,000 | $74,700 |
| 2024 | $6,669 | $816,700 | $742,000 | $74,700 |
| 2023 | $5,958 | $768,700 | $682,000 | $86,700 |
| 2022 | $5,496 | $572,700 | $502,000 | $70,700 |
| 2020 | $4,804 | $459,500 | $402,000 | $57,500 |
| 2019 | $4,409 | $435,200 | $382,000 | $53,200 |
| 2018 | $4,084 | $372,100 | $322,000 | $50,100 |
| 2017 | $4,488 | $430,100 | $382,000 | $48,100 |
| 2016 | $3,987 | $368,600 | $322,000 | $46,600 |
| 2015 | $3,926 | $348,100 | $312,000 | $36,100 |
| 2013 | $3,669 | $305,500 | $272,000 | $33,500 |
Source: Public Records
Map
Nearby Homes
- 19904 Soundview Dr NW
- 9003 196th Place NW
- 19422 Soundview Dr NW
- 8817 Lakewood Rd
- 18826 94th Dr NW
- 18815 Clarence Ave
- 0 NHNB Clarence Ave
- 0 NHNA Clarence Ave
- 20909 Frank Waters Rd
- 21426 81st Ave NW
- 8203 Lakewood Rd
- The Sylvia Plan at Warm Beach Heights
- 18612 98th Ave NW
- 7519 184th St NW
- 17930 82nd Dr NW
- 690 X Olive Ave
- 16906 Marine Dr
- 16818 Marine Dr
- 6901 Olive Ave
- 6828 Olive Ave
- 20126 Beach Dr
- 20220 Beach Dr
- 20125 Beach Dr
- 20110 Beach Dr
- 20224 Beach Dr
- 20224 Beach Dr
- 20116 Beach Dr
- 1336 Beach Dr
- 20106 Beach Dr
- 20103 Beach Dr
- 20304 Beach Dr
- 9205 201st St NW
- 20028 Beach Dr
- 20310 Beach Dr
- 9107 201st St NW
- 20020 Beach Dr
- 20324 Beach Dr
- 20008 92nd Ave NW
- 20332 Beach Dr
- 9211 200th St NW