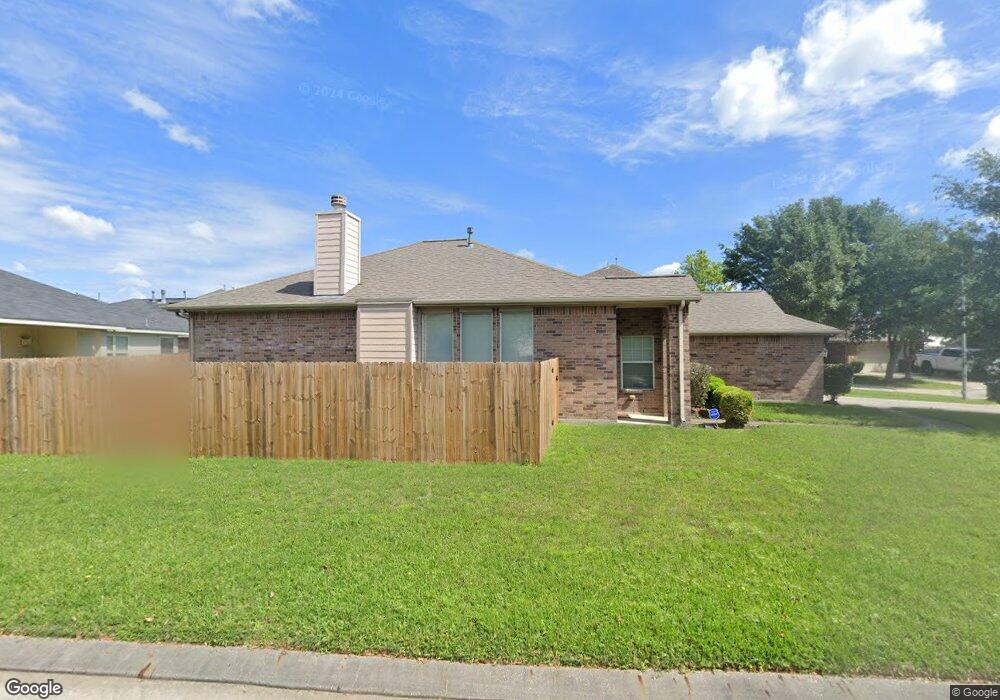
20203 Maple Rapids Ct Humble, TX 77338
Estimated Value: $230,000 - $262,000
3
Beds
2
Baths
1,735
Sq Ft
$140/Sq Ft
Est. Value
About This Home
This home is located at 20203 Maple Rapids Ct, Humble, TX 77338 and is currently estimated at $243,758, approximately $140 per square foot. 20203 Maple Rapids Ct is a home located in Harris County with nearby schools including Jones Elementary School, Jones Middle, and Nimitz Ninth Grade School.
Ownership History
Date
Name
Owned For
Owner Type
Purchase Details
Closed on
Aug 29, 2019
Sold by
Ebisuya Eric Todd
Bought by
Holley Tina Dionne and Holley Kirbe D
Current Estimated Value
Home Financials for this Owner
Home Financials are based on the most recent Mortgage that was taken out on this home.
Original Mortgage
$168,393
Outstanding Balance
$152,088
Interest Rate
5.25%
Mortgage Type
FHA
Estimated Equity
$91,670
Purchase Details
Closed on
Jan 13, 2014
Sold by
Ebisuya Eric Todd
Bought by
Jpmorgan Chase Bank Na
Purchase Details
Closed on
Jul 31, 2008
Sold by
Choice Homes Inc
Bought by
Ebisuya Eric Todd
Home Financials for this Owner
Home Financials are based on the most recent Mortgage that was taken out on this home.
Original Mortgage
$153,784
Interest Rate
6.4%
Mortgage Type
FHA
Purchase Details
Closed on
May 6, 2008
Sold by
Deerbrook Estates Ltd
Bought by
Choice Homes Inc
Create a Home Valuation Report for This Property
The Home Valuation Report is an in-depth analysis detailing your home's value as well as a comparison with similar homes in the area
Home Values in the Area
Average Home Value in this Area
Purchase History
| Date | Buyer | Sale Price | Title Company |
|---|---|---|---|
| Holley Tina Dionne | -- | First American Title | |
| Jpmorgan Chase Bank Na | $120,350 | None Available | |
| Ebisuya Eric Todd | -- | Fatco | |
| Choice Homes Inc | -- | Fatco |
Source: Public Records
Mortgage History
| Date | Status | Borrower | Loan Amount |
|---|---|---|---|
| Open | Holley Tina Dionne | $168,393 | |
| Previous Owner | Ebisuya Eric Todd | $153,784 | |
| Closed | Choice Homes Inc | $0 |
Source: Public Records
Tax History Compared to Growth
Tax History
| Year | Tax Paid | Tax Assessment Tax Assessment Total Assessment is a certain percentage of the fair market value that is determined by local assessors to be the total taxable value of land and additions on the property. | Land | Improvement |
|---|---|---|---|---|
| 2025 | $4,219 | $221,197 | $40,662 | $180,535 |
| 2024 | $4,219 | $223,426 | $40,662 | $182,764 |
| 2023 | $4,219 | $246,739 | $40,662 | $206,077 |
| 2022 | $5,426 | $219,873 | $29,045 | $190,828 |
| 2021 | $5,150 | $187,731 | $29,045 | $158,686 |
| 2020 | $4,958 | $171,770 | $29,045 | $142,725 |
| 2019 | $4,901 | $163,089 | $29,045 | $134,044 |
| 2018 | $2,150 | $149,700 | $29,045 | $120,655 |
| 2017 | $4,396 | $149,700 | $29,045 | $120,655 |
| 2016 | $4,396 | $149,700 | $29,045 | $120,655 |
| 2015 | $3,372 | $140,806 | $29,045 | $111,761 |
| 2014 | $3,372 | $134,374 | $29,045 | $105,329 |
Source: Public Records
Map
Nearby Homes
- 20206 Sweet Magnolia Place
- 8830 River Dale Canyon Ln
- 20011 Lions Gate Dr
- 0 Deerbrook Park Blvd
- 19907 Lions Gate Dr
- 5815 Patriot Sound Dr
- 5934 Patriot Sound Dr
- 0 Countryside Ln Unit 5441950
- 19722 Belle Isle Dr
- 8826 W Humble Westfield Rd
- 20307 Lionsgate Ln
- 20003 Bolton Bridge Ln
- 9010 Grackle Run Ln
- 9006 Wildbird Ln
- 20454 Moon Walk Dr
- 8925 Elm Drake Ln
- 8918 Elm Drake Ln
- 9107 River Dale Canyon Ln
- 9115 Aspen Trace Ln
- 19830 Bolton Bridge Ln
- 20203 Maple Rapids Ct Unit 1
- 20207 Maple Rapids Ct
- 20202 Sweet Magnolia Place
- 8710 Maple Rapids Ln
- 8714 Maple Rapids Ln
- 8706 Maple Rapids Ln
- 8718 Maple Rapids Ln
- 20211 Maple Rapids Ct
- 20210 Maple Rapids Ct
- 8702 Maple Rapids Ln
- 20202 Maple Rapids Ct
- 20210 Sweet Magnolia Place
- 8722 Maple Rapids Ln
- 20206 Maple Rapids Ct
- 8726 Maple Rapids Ln
- 8715 Farm Ridge Ln
- 20214 Sweet Magnolia Place
- 20203 Sweet Magnolia Place
- 8719 Farm Ridge Ln
- 8730 Maple Rapids Ln