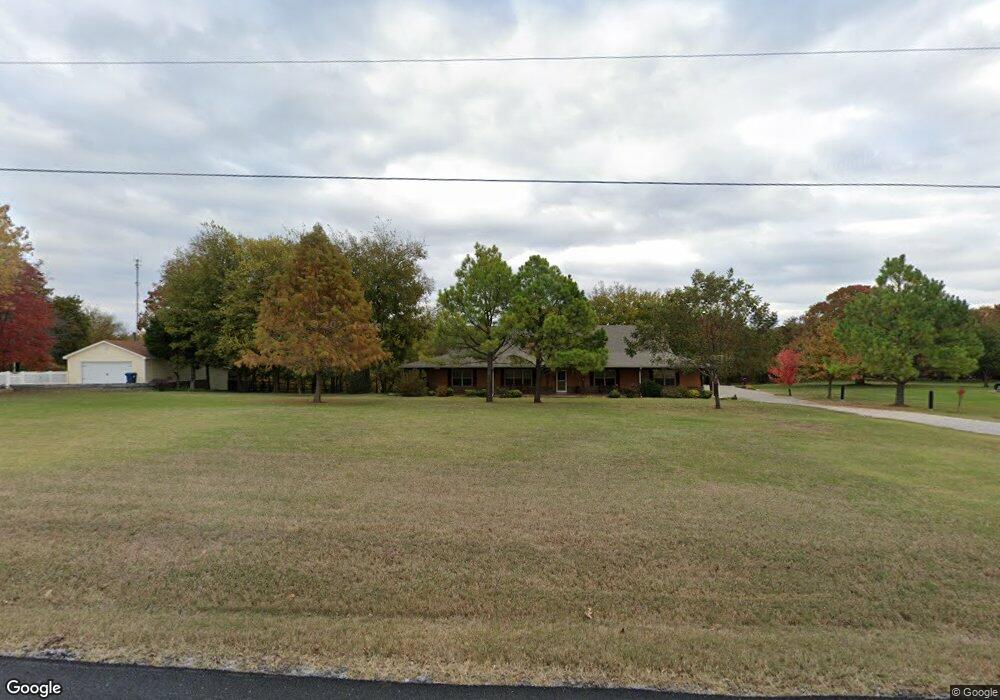
20205 S 4092 Rd Claremore, OK 74019
Estimated Value: $331,000 - $401,988
3
Beds
2
Baths
2,059
Sq Ft
$182/Sq Ft
Est. Value
About This Home
This home is located at 20205 S 4092 Rd, Claremore, OK 74019 and is currently estimated at $374,747, approximately $182 per square foot. 20205 S 4092 Rd is a home with nearby schools including Stone Canyon Elementary School, Owasso 6th Grade Center, and Owasso 8th Grade Center.
Ownership History
Date
Name
Owned For
Owner Type
Purchase Details
Closed on
Jun 5, 2020
Sold by
Allen Jimmy and Allen Nancy
Bought by
Allen Jimmy and Allen Nancy
Current Estimated Value
Purchase Details
Closed on
Aug 23, 2007
Sold by
Allen Jim and Allen Nancy
Bought by
Allen Jim and Allen Nancy
Purchase Details
Closed on
Jun 9, 2006
Sold by
Ellard Bret L and Estate Of Anita Larue Ellard
Bought by
Allen Jim and Allen Nancy
Create a Home Valuation Report for This Property
The Home Valuation Report is an in-depth analysis detailing your home's value as well as a comparison with similar homes in the area
Home Values in the Area
Average Home Value in this Area
Purchase History
| Date | Buyer | Sale Price | Title Company |
|---|---|---|---|
| Allen Jimmy | -- | None Available | |
| Allen Jim | -- | None Available | |
| Allen Jim | $42,000 | Land Title Closing Services |
Source: Public Records
Tax History Compared to Growth
Tax History
| Year | Tax Paid | Tax Assessment Tax Assessment Total Assessment is a certain percentage of the fair market value that is determined by local assessors to be the total taxable value of land and additions on the property. | Land | Improvement |
|---|---|---|---|---|
| 2025 | $3,296 | $31,659 | $5,804 | $25,855 |
| 2024 | $3,296 | $30,737 | $5,635 | $25,102 |
| 2023 | $3,296 | $29,841 | $5,479 | $24,362 |
| 2022 | $3,155 | $28,973 | $5,420 | $23,553 |
| 2021 | $3,026 | $28,581 | $5,500 | $23,081 |
| 2020 | $2,932 | $28,128 | $5,493 | $22,635 |
| 2019 | $2,845 | $26,514 | $4,950 | $21,564 |
| 2018 | $2,770 | $26,670 | $4,950 | $21,720 |
| 2017 | $2,773 | $26,466 | $4,950 | $21,516 |
| 2016 | $2,696 | $25,734 | $4,950 | $20,784 |
| 2015 | $2,638 | $24,984 | $4,950 | $20,034 |
| 2014 | $2,572 | $24,257 | $4,950 | $19,307 |
Source: Public Records
Map
Nearby Homes
- 20225 S 4092 Rd
- 6255 E Canyon View Dr
- 6025 E Highway 20
- 20612 S Skyline View Rd
- 20775 S Skyline View Rd
- 6178 Fulham St
- 6 E Highway 20
- 4 E Highway 20
- 20906 S Windsor Ave
- 20903 S Richmond Ave
- 20823 S Concord Ave
- 20603 S Concord Ave
- 5226 E Madison St
- 20624 S Brentwood Ave
- 5207 E Brookhaven St
- 5132 E Madison St
- 5113 E Madison St
- 11381 N 209th E
- 4728 E Hwy 20
- 20932 S Addison Ave
- 20177 S 4092 Rd
- 20295 S 4092 Rd
- 20276 S 4092 Rd
- 6285 E Canyon View Dr
- 20097 S 4092 Rd
- 20312 S Canyon View Dr
- 20315 S Canyon View Dr
- 6332 E 480 Rd
- 20354 S Canyon View Dr
- 6168 E 480 Rd
- 6293 E 480 Rd
- 6110 E 480 Rd
- 20404 S Canyon View Dr
- 20414 S 4092 Rd
- 0 E Hwy 20 Rd Unit 2336713
- 0 E Hwy 20 Rd Unit 2336710
- 0 E Hwy 20 Rd Unit 2332009
- 0 E Hwy 20 Rd Unit 1701119
- 0 E Hwy 20 Rd Unit 1737325
- 0 E Hwy 20 Rd Unit 1811215