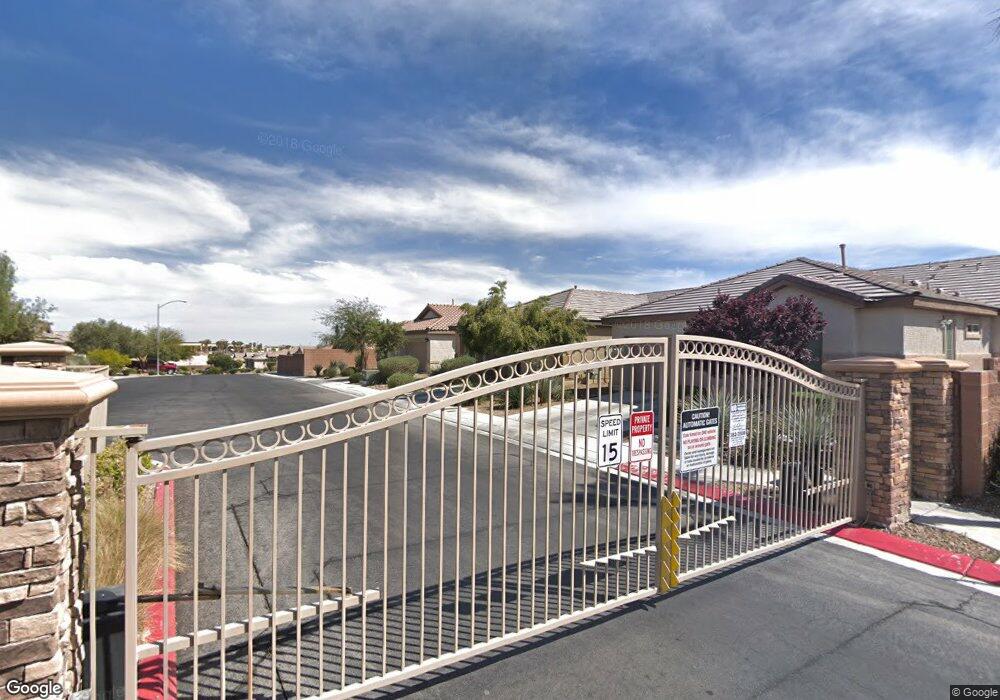
2021 Dolphin Beach Ave North Las Vegas, NV 89081
Northridge NeighborhoodEstimated Value: $358,442 - $387,000
3
Beds
2
Baths
1,371
Sq Ft
$272/Sq Ft
Est. Value
About This Home
This home is located at 2021 Dolphin Beach Ave, North Las Vegas, NV 89081 and is currently estimated at $373,361, approximately $272 per square foot. 2021 Dolphin Beach Ave is a home located in Clark County with nearby schools including Jesse D. Scott Elementary School, Carroll M. Johnston STEM Academy of Environmental Studies, and Clifford O. Findlay Middle School.
Ownership History
Date
Name
Owned For
Owner Type
Purchase Details
Closed on
Sep 15, 2009
Sold by
Centex Homes
Bought by
Alpuerto Estelito S and Alpuerto Chona A
Current Estimated Value
Home Financials for this Owner
Home Financials are based on the most recent Mortgage that was taken out on this home.
Original Mortgage
$117,826
Outstanding Balance
$77,019
Interest Rate
5.18%
Mortgage Type
FHA
Estimated Equity
$296,342
Create a Home Valuation Report for This Property
The Home Valuation Report is an in-depth analysis detailing your home's value as well as a comparison with similar homes in the area
Home Values in the Area
Average Home Value in this Area
Purchase History
| Date | Buyer | Sale Price | Title Company |
|---|---|---|---|
| Alpuerto Estelito S | $120,000 | Commerce Title Las Vegas |
Source: Public Records
Mortgage History
| Date | Status | Borrower | Loan Amount |
|---|---|---|---|
| Open | Alpuerto Estelito S | $117,826 |
Source: Public Records
Tax History Compared to Growth
Tax History
| Year | Tax Paid | Tax Assessment Tax Assessment Total Assessment is a certain percentage of the fair market value that is determined by local assessors to be the total taxable value of land and additions on the property. | Land | Improvement |
|---|---|---|---|---|
| 2025 | $1,273 | $107,527 | $30,450 | $77,077 |
| 2024 | $1,236 | $107,527 | $30,450 | $77,077 |
| 2023 | $1,236 | $99,832 | $27,300 | $72,532 |
| 2022 | $1,200 | $88,084 | $22,050 | $66,034 |
| 2021 | $1,165 | $83,710 | $21,000 | $62,710 |
| 2020 | $1,129 | $80,036 | $19,950 | $60,086 |
| 2019 | $1,096 | $72,793 | $17,500 | $55,293 |
| 2018 | $1,060 | $64,760 | $14,000 | $50,760 |
| 2017 | $1,943 | $57,930 | $11,900 | $46,030 |
| 2016 | $1,004 | $50,115 | $9,800 | $40,315 |
| 2015 | $1,001 | $44,847 | $8,050 | $36,797 |
| 2014 | $970 | $28,062 | $5,950 | $22,112 |
Source: Public Records
Map
Nearby Homes
- 2109 Puffer Beach Ct Unit 1
- 5737 Fleming St
- 5713 Lawrence St
- 5929 Yee Haw St
- 5685 Colbert St
- 5712 Nobleton Ct
- 5630 Midnight Breeze St
- 5614 Midnight Breeze St
- 5605 Midnight Breeze St
- 2117 Leatherbridge Ct
- 5917 Yee Haw St
- 5913 Yee Haw St
- Alma Plan at Grandview
- Eden Plan at Grandview
- Caden Plan at Grandview
- 1602 Morning Bell Ave
- 5733 Tall Redstone St
- 1114 Crystal Grotto Ave
- 1817 Cosmo Star Ave
- 1110 Crystal Grotto Ave
- 2017 Dolphin Beach Ave
- 5829 Black Sand Beach St
- 5825 Black Sand Beach St
- 2013 Dolphin Beach Ave
- 5821 Black Sand Beach St
- 2016 Turtle Beach Ave
- 2020 Turtle Beach Ave
- 2012 Turtle Beach Ave
- 5817 Black Sand Beach St
- 2024 Dolphin Beach Ave
- 2020 Dolphin Beach Ave
- 2104 Dolphin Beach Ave
- 2108 Dolphin Beach Ave
- 5813 Black Sand Beach St
- 2117 Dolphin Beach Ave
- 2112 Dolphin Beach Ave
- 2017 Puffer Beach Ct
- 2116 Turtle Beach Ave
- 2013 Puffer Beach Ct
- 2116 Dolphin Beach Ave
