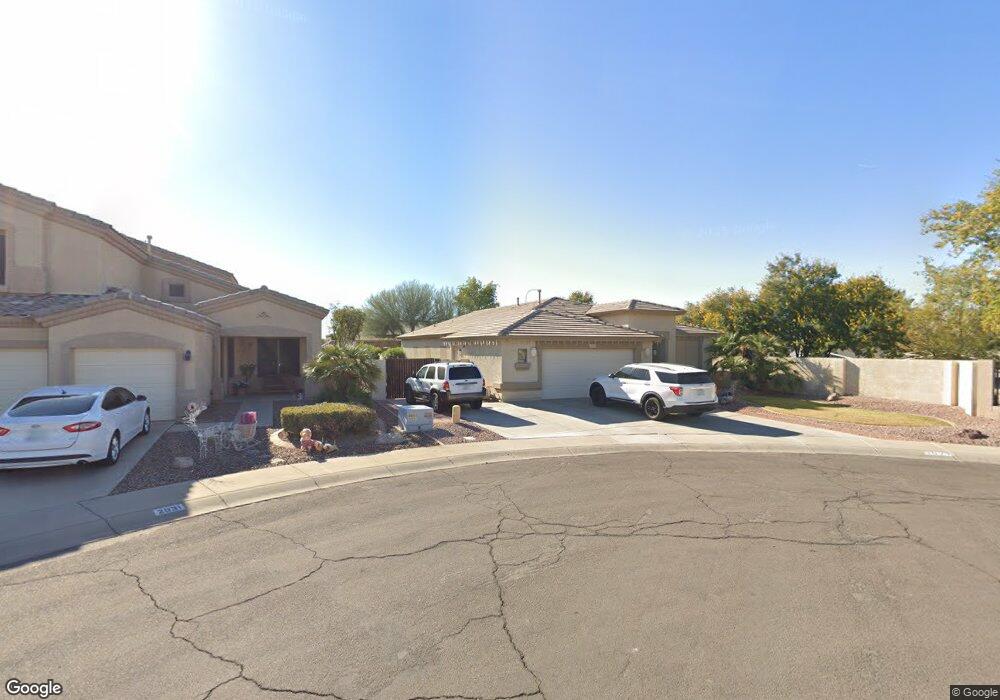
2021 E Runaway Bay Place Chandler, AZ 85249
South Chandler NeighborhoodEstimated Value: $453,400 - $552,000
--
Bed
3
Baths
2,010
Sq Ft
$259/Sq Ft
Est. Value
About This Home
This home is located at 2021 E Runaway Bay Place, Chandler, AZ 85249 and is currently estimated at $520,600, approximately $259 per square foot. 2021 E Runaway Bay Place is a home located in Maricopa County with nearby schools including Jane D. Hull Elementary School, Santan Junior High School, and BASIS Chandler Primary South Campus.
Ownership History
Date
Name
Owned For
Owner Type
Purchase Details
Closed on
May 14, 2001
Sold by
Morrison Homes Of Arizona Inc
Bought by
Vanantwerp Ronald W and Vanantwerp Lynn A
Current Estimated Value
Home Financials for this Owner
Home Financials are based on the most recent Mortgage that was taken out on this home.
Original Mortgage
$159,650
Interest Rate
6.91%
Mortgage Type
VA
Create a Home Valuation Report for This Property
The Home Valuation Report is an in-depth analysis detailing your home's value as well as a comparison with similar homes in the area
Home Values in the Area
Average Home Value in this Area
Purchase History
| Date | Buyer | Sale Price | Title Company |
|---|---|---|---|
| Vanantwerp Ronald W | $168,073 | First American Title | |
| Morrison Homes Of Arizona Inc | -- | First American Title |
Source: Public Records
Mortgage History
| Date | Status | Borrower | Loan Amount |
|---|---|---|---|
| Previous Owner | Vanantwerp Ronald W | $159,650 |
Source: Public Records
Tax History Compared to Growth
Tax History
| Year | Tax Paid | Tax Assessment Tax Assessment Total Assessment is a certain percentage of the fair market value that is determined by local assessors to be the total taxable value of land and additions on the property. | Land | Improvement |
|---|---|---|---|---|
| 2025 | $1,905 | $23,988 | -- | -- |
| 2024 | $1,841 | $22,845 | -- | -- |
| 2023 | $1,841 | $38,270 | $7,650 | $30,620 |
| 2022 | $1,777 | $28,650 | $5,730 | $22,920 |
| 2021 | $1,855 | $26,230 | $5,240 | $20,990 |
| 2020 | $1,846 | $25,120 | $5,020 | $20,100 |
| 2019 | $1,776 | $22,720 | $4,540 | $18,180 |
| 2018 | $1,718 | $21,100 | $4,220 | $16,880 |
| 2017 | $1,604 | $19,620 | $3,920 | $15,700 |
| 2016 | $1,537 | $19,230 | $3,840 | $15,390 |
| 2015 | $1,494 | $17,800 | $3,560 | $14,240 |
Source: Public Records
Map
Nearby Homes
- 2055 E Indian Wells Dr
- 6412 S Oakmont Dr
- 6512 S Sawgrass Dr
- 1842 E Riviera Dr
- 6581 S Salt Cedar Place
- 1880 E Winged Foot Dr
- 1863 E Buena Vista Dr
- 6114 S Sawgrass Dr
- 1863 E Torrey Pines Ln
- 2171 E Augusta Ave
- 2283 E Torrey Pines Place
- 6500 S Championship Dr
- 6711 S Coral Gable Dr
- 6249 S Championship Dr
- 1941 E Kerby Farms Rd
- 6318 S Sundown Dr
- 1881 E Kerby Farms Rd
- 6200 S Championship Dr
- 6279 S Sundown Dr
- 1831 E Kerby Farms Rd
- 2031 E Runaway Bay Place
- 2022 E La Costa Dr
- 2041 E Runaway Bay Place
- 2032 E La Costa Dr
- 2042 E La Costa Dr
- 6361 S Oakmont Dr
- 6351 S Oakmont Dr
- 6371 S Oakmont Dr
- 2051 E Runaway Bay Place
- 6341 S Oakmont Dr
- 2020 E Runaway Bay Place
- 6381 S Oakmont Dr
- 2030 E Runaway Bay Place
- 2052 E La Costa Dr
- 6331 S Oakmont Dr Unit 5
- 6331 S Oakmont Dr
- 2040 E Runaway Bay Place
- 6321 S Oakmont Dr
- 2061 E Runaway Bay Place
- 6401 S Oakmont Dr