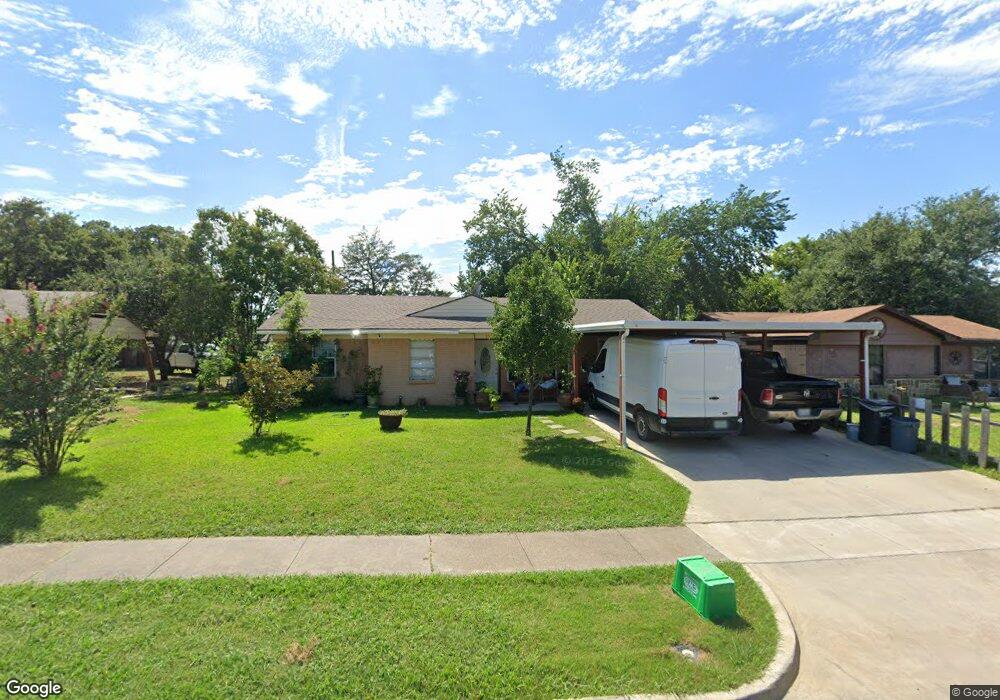
2021 Mount Pleasant Dr Mesquite, TX 75149
Estimated Value: $235,725 - $243,000
3
Beds
1
Bath
1,592
Sq Ft
$150/Sq Ft
Est. Value
About This Home
This home is located at 2021 Mount Pleasant Dr, Mesquite, TX 75149 and is currently estimated at $238,431, approximately $149 per square foot. 2021 Mount Pleasant Dr is a home located in Dallas County with nearby schools including Mcwhorter Elementary School, Lanny Frasier Middle, and West Mesquite High School.
Ownership History
Date
Name
Owned For
Owner Type
Purchase Details
Closed on
Oct 26, 2000
Sold by
Five By Five Investments Lp
Bought by
Palacio Alvaro and Garcia Matilde
Current Estimated Value
Home Financials for this Owner
Home Financials are based on the most recent Mortgage that was taken out on this home.
Original Mortgage
$58,500
Outstanding Balance
$21,571
Interest Rate
7.89%
Mortgage Type
Seller Take Back
Estimated Equity
$216,860
Purchase Details
Closed on
Mar 15, 1996
Sold by
John Dangelo Inc
Bought by
Five By Five Investments Lp
Home Financials for this Owner
Home Financials are based on the most recent Mortgage that was taken out on this home.
Original Mortgage
$20,000
Interest Rate
7.02%
Purchase Details
Closed on
Mar 12, 1996
Sold by
Meador Joey and Meador Joe Noel
Bought by
John Dangelo Inc
Home Financials for this Owner
Home Financials are based on the most recent Mortgage that was taken out on this home.
Original Mortgage
$20,000
Interest Rate
7.02%
Create a Home Valuation Report for This Property
The Home Valuation Report is an in-depth analysis detailing your home's value as well as a comparison with similar homes in the area
Home Values in the Area
Average Home Value in this Area
Purchase History
| Date | Buyer | Sale Price | Title Company |
|---|---|---|---|
| Palacio Alvaro | -- | -- | |
| Five By Five Investments Lp | -- | -- | |
| John Dangelo Inc | -- | -- |
Source: Public Records
Mortgage History
| Date | Status | Borrower | Loan Amount |
|---|---|---|---|
| Open | Palacio Alvaro | $58,500 | |
| Previous Owner | Five By Five Investments Lp | $20,000 |
Source: Public Records
Tax History Compared to Growth
Tax History
| Year | Tax Paid | Tax Assessment Tax Assessment Total Assessment is a certain percentage of the fair market value that is determined by local assessors to be the total taxable value of land and additions on the property. | Land | Improvement |
|---|---|---|---|---|
| 2025 | $1,655 | $245,890 | $55,000 | $190,890 |
| 2024 | $1,655 | $245,890 | $55,000 | $190,890 |
| 2023 | $1,655 | $226,000 | $40,000 | $186,000 |
| 2022 | $5,678 | $226,000 | $40,000 | $186,000 |
| 2021 | $4,488 | $170,180 | $30,000 | $140,180 |
| 2020 | $3,980 | $142,390 | $30,000 | $112,390 |
| 2019 | $3,206 | $110,150 | $30,000 | $80,150 |
| 2018 | $2,598 | $92,660 | $26,000 | $66,660 |
| 2017 | $2,112 | $75,380 | $15,000 | $60,380 |
| 2016 | $1,708 | $60,950 | $15,000 | $45,950 |
| 2015 | $1,098 | $50,750 | $15,000 | $35,750 |
| 2014 | $1,098 | $50,750 | $15,000 | $35,750 |
Source: Public Records
Map
Nearby Homes
- 1410 Athens Dr
- Lot 15 Central Park Ct
- Lot 14 Central Park Ct
- 1222 Athens Dr
- 1325 Woodcrest Dr
- 1229 Greenbrier Dr
- 1309 Woodcrest Dr
- 11915 Carson Dr
- 2441 Lindale Ln
- 2429 Hickory Tree Rd
- 1505 W Bruton Rd
- 1317 W Bruton Rd
- 1905 Blossom Trail
- 1901 Blossom Trail
- 1300 Develon Dr
- 2510 Lora Ln
- 1756 Julie Ct
- 2511 Lora Ln
- 2633 Dean St
- 2629 Dean St
- 2017 Mount Pleasant Dr
- 2027 Mount Pleasant Dr
- 2013 Mount Pleasant Dr
- 2024 Sycamore Dr
- 2028 Sycamore Dr
- 2020 Sycamore Dr
- 2020 Mount Pleasant Dr
- 2024 Mount Pleasant Dr
- 2009 Mount Pleasant Dr
- 2016 Sycamore Dr
- 2016 Mount Pleasant Dr
- 2028 Mount Pleasant Dr
- 1404 Edgemont Dr
- 1408 Edgemont Dr
- 2012 Mount Pleasant Dr
- 1400 Edgemont Dr
- 2012 Sycamore Dr
- 1412 Edgemont Dr
- 2005 Mount Pleasant Dr
- 1320 Edgemont Dr