Estimated Value: $339,000 - $373,000
3
Beds
2
Baths
1,676
Sq Ft
$211/Sq Ft
Est. Value
About This Home
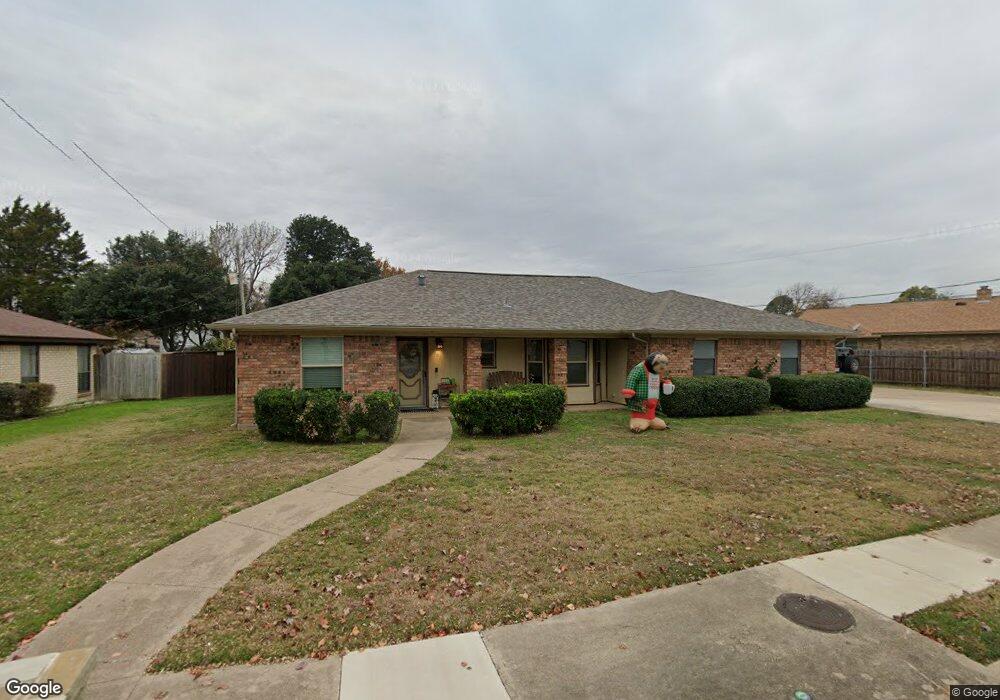
This home is located at 2021 Norwood Dr, Hurst, TX 76054 and is currently estimated at $354,003, approximately $211 per square foot. 2021 Norwood Dr is a home located in Tarrant County with nearby schools including Shady Oaks Elementary School, Bedford Junior High School, and L.D. Bell High School.
Ownership History
Date
Name
Owned For
Owner Type
Purchase Details
Closed on
Sep 27, 2021
Sold by
Wright Darrik
Bought by
Wright Darrik and Wright Stacey
Current Estimated Value
Home Financials for this Owner
Home Financials are based on the most recent Mortgage that was taken out on this home.
Original Mortgage
$150,000
Outstanding Balance
$136,786
Interest Rate
2.8%
Mortgage Type
New Conventional
Estimated Equity
$217,217
Purchase Details
Closed on
Aug 18, 2010
Sold by
Hyun Ki Yul and Hyun Min Ja
Bought by
Wright Darrik
Home Financials for this Owner
Home Financials are based on the most recent Mortgage that was taken out on this home.
Original Mortgage
$119,392
Interest Rate
5.5%
Mortgage Type
FHA
Purchase Details
Closed on
Mar 5, 2006
Sold by
Hyun Kiyul and Hyun Min Ja
Bought by
Hyun Kiyul and Hyun Min Ja
Create a Home Valuation Report for This Property
The Home Valuation Report is an in-depth analysis detailing your home's value as well as a comparison with similar homes in the area
Home Values in the Area
Average Home Value in this Area
Purchase History
| Date | Buyer | Sale Price | Title Company |
|---|---|---|---|
| Wright Darrik | -- | Closing Usa Llc | |
| Wright Darrik | -- | Alamo Title Company | |
| Hyun Kiyul | -- | None Available |
Source: Public Records
Mortgage History
| Date | Status | Borrower | Loan Amount |
|---|---|---|---|
| Open | Wright Darrik | $150,000 | |
| Closed | Wright Darrik | $119,392 |
Source: Public Records
Tax History Compared to Growth
Tax History
| Year | Tax Paid | Tax Assessment Tax Assessment Total Assessment is a certain percentage of the fair market value that is determined by local assessors to be the total taxable value of land and additions on the property. | Land | Improvement |
|---|---|---|---|---|
| 2025 | $4,820 | $315,779 | $75,000 | $240,779 |
| 2024 | $4,820 | $315,779 | $75,000 | $240,779 |
| 2023 | $6,131 | $315,264 | $55,000 | $260,264 |
| 2022 | $6,406 | $280,475 | $55,000 | $225,475 |
| 2021 | $6,100 | $252,917 | $55,000 | $197,917 |
| 2020 | $5,577 | $231,797 | $55,000 | $176,797 |
| 2019 | $5,905 | $241,278 | $55,000 | $186,278 |
| 2018 | $5,393 | $220,367 | $55,000 | $165,367 |
| 2017 | $4,675 | $184,735 | $18,000 | $166,735 |
| 2016 | $4,365 | $172,476 | $18,000 | $154,476 |
| 2015 | $3,627 | $138,300 | $18,000 | $120,300 |
| 2014 | $3,627 | $138,300 | $18,000 | $120,300 |
Source: Public Records
Map
Nearby Homes
- 421 Cavender Ct
- 432 Sunnybrook Ct
- 404 Heather Ln
- 2212 Hurstview Dr
- 320 Blue Quail Ct
- 121 Kay Ct
- 124 Jeannie Ct
- 2244 Hurstview Dr
- 440 W Louella Dr
- 305 Warbler Dr
- 1732 Jeannie Ln
- 100 Hillview Ct
- 520 Baker Dr
- 405 Woodbriar Ct
- 1740 Brown Trail
- 3713 Brentwood Ct
- 817 Shady Lake Dr
- 2620 Brookridge Dr
- 3213 Spring Valley Dr
- 425 W Pleasantview Dr
- 2017 Norwood Dr
- 301 Stratford Dr
- 309 Stratford Dr
- 304 Mountainview Dr
- 2013 Norwood Dr
- 236 Carolyn Dr
- 239 Carolyn Dr
- 308 Mountainview Dr
- 313 Stratford Dr
- 209 Stratford Ct
- 244 Mountainview Dr
- 232 Carolyn Dr
- 304 Stratford Dr
- 312 Mountainview Dr
- 308 Stratford Dr
- 235 Carolyn Dr
- 300 Stratford Dr
- 317 Stratford Dr
- 312 Stratford Dr
- 213 Stratford Ct