
Seller's Agent in 2026
Naama Shaked
Berkshire Hathaway HomeService
(919) 670-6380
19 in this area
256 Total Sales


Stylish and spacious with thoughtful upgrades, this 5-bedroom, 3-bath home is ready to impress.
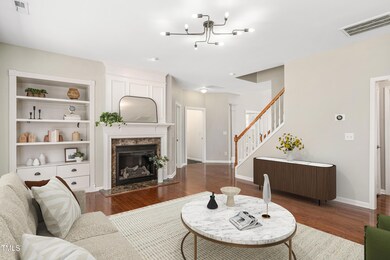
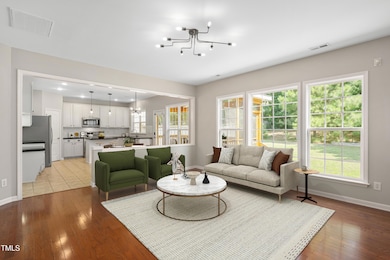
This open floor plan features a chef's kitchen with white cabinets, granite counters, stainless steel appliances, tons of storage, and a walk-in pantry. It flows right into a spacious living area with a fireplace and custom built-ins.
The main floor also offers a dedicated office plus a guest bedroom and full bath, ideal for visitors.
Upstairs, you'll find a generous owner's suite with a beautifully renovated spa-like bath (2021), complete with double vanities, a stunning shower, a stand-alone soaking tub, and a massive walk-in closet. Three additional bedrooms and a large bonus room give you all the space you need for work, play, or simply spreading out.
Love spending time outside? You'll enjoy the big, screened porch (added in 2022) overlooking a private backyard lined with mature trees, a perfect spot for morning coffee or evening get togethers.
Sought-after location just minutes from Beaver Creek Commons, shopping, groceries, and local restaurants, plus quick access to Hwy 64, 55, and 540 to get wherever you need to go.
Last Agent to Sell the Property
Berkshire Hathaway HomeService License #284026 Listed on: 07/10/2025
| Date | Type | Sale Price | Title Company |
|---|---|---|---|
| Warranty Deed | $729,000 | None Listed On Document | |
| Warranty Deed | $395,000 | None Available | |
| Warranty Deed | $280,000 | None Available | |
| Warranty Deed | $361,000 | None Available |
| Date | Status | Loan Amount | Loan Type |
|---|---|---|---|
| Open | $500,000 | New Conventional | |
| Previous Owner | $335,750 | New Conventional | |
| Previous Owner | $251,550 | Adjustable Rate Mortgage/ARM | |
| Previous Owner | $280,000 | Purchase Money Mortgage |
| Date | Event | Price | List to Sale | Price per Sq Ft |
|---|---|---|---|---|
| 01/23/2026 01/23/26 | Sold | $729,000 | -2.8% | $250 / Sq Ft |
| 12/08/2025 12/08/25 | Pending | -- | -- | -- |
| 10/30/2025 10/30/25 | Price Changed | $749,900 | -1.3% | $257 / Sq Ft |
| 10/04/2025 10/04/25 | Price Changed | $760,000 | -1.9% | $260 / Sq Ft |
| 08/22/2025 08/22/25 | Price Changed | $775,000 | -1.3% | $266 / Sq Ft |
| 07/10/2025 07/10/25 | For Sale | $785,000 | -- | $269 / Sq Ft |
| Year | Tax Paid | Tax Assessment Tax Assessment Total Assessment is a certain percentage of the fair market value that is determined by local assessors to be the total taxable value of land and additions on the property. | Land | Improvement |
|---|---|---|---|---|
| 2025 | $5,395 | $615,654 | $200,000 | $415,654 |
| 2024 | $5,275 | $615,654 | $200,000 | $415,654 |
| 2023 | $4,733 | $429,601 | $95,000 | $334,601 |
| 2022 | $4,443 | $429,601 | $95,000 | $334,601 |
| 2021 | $4,231 | $425,400 | $95,000 | $330,400 |
| 2020 | $4,189 | $425,400 | $95,000 | $330,400 |
| 2019 | $4,048 | $354,694 | $95,000 | $259,694 |
| 2018 | $3,813 | $354,694 | $95,000 | $259,694 |
| 2017 | $3,549 | $354,694 | $95,000 | $259,694 |
| 2016 | $3,498 | $354,694 | $95,000 | $259,694 |
| 2015 | $3,460 | $342,469 | $84,000 | $258,469 |
| 2014 | $3,335 | $342,469 | $84,000 | $258,469 |
Seller's Agent in 2026
Naama Shaked
Berkshire Hathaway HomeService
(919) 670-6380
19 in this area
256 Total Sales
H
Buyer's Agent in 2026
Hank Xiao
CHK Realty
(919) 360-9473
1 in this area
22 Total Sales
Source: Doorify MLS
MLS Number: 10108465
APN: 0733.04-93-7176-000
Disclaimer: Certain information contained herein is derived from information provided by parties other than Homes.com. All information provided is deemed reliable, but is not guaranteed to be accurate and should be independently verified.
![]() Some IDX listings have been excluded from this IDX display. Brokers make an effort to deliver accurate information, but buyers should independently verify any information on which they will rely in a transaction. The listing broker shall not be responsible for any typographical errors, misinformation, or misprints, and they shall be held totally harmless from any damages arising from reliance upon this data. This data is provided exclusively for consumers’ personal, non-commercial use. Listings marked with an icon are provided courtesy of the Doorify MLS, Inc. of North Carolina, Internet Data Exchange Database. Closed (sold) listings may have been listed and/or sold by a real estate firm other than the firm(s) featured on this website. Closed data is not available until the sale of the property is recorded in the MLS. Home sale data is not an appraisal, CMA, competitive or comparative market analysis, or home valuation of any property. Copyright 2026 Doorify MLS, Inc. of North Carolina. All rights reserved.
Some IDX listings have been excluded from this IDX display. Brokers make an effort to deliver accurate information, but buyers should independently verify any information on which they will rely in a transaction. The listing broker shall not be responsible for any typographical errors, misinformation, or misprints, and they shall be held totally harmless from any damages arising from reliance upon this data. This data is provided exclusively for consumers’ personal, non-commercial use. Listings marked with an icon are provided courtesy of the Doorify MLS, Inc. of North Carolina, Internet Data Exchange Database. Closed (sold) listings may have been listed and/or sold by a real estate firm other than the firm(s) featured on this website. Closed data is not available until the sale of the property is recorded in the MLS. Home sale data is not an appraisal, CMA, competitive or comparative market analysis, or home valuation of any property. Copyright 2026 Doorify MLS, Inc. of North Carolina. All rights reserved.
Ask me questions while you tour the home.