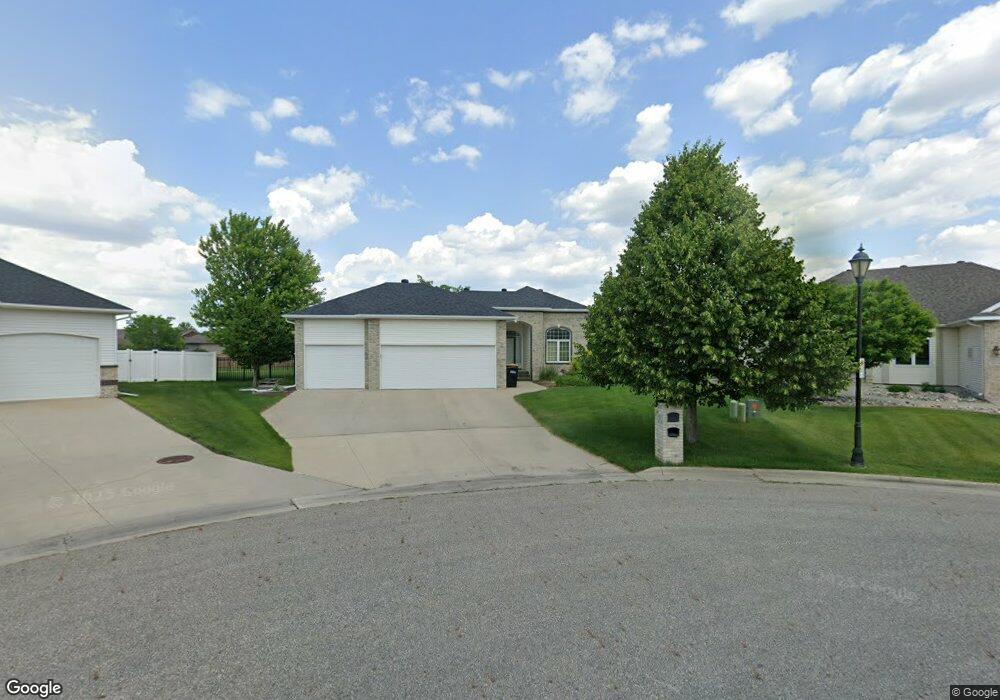
2021 Ruttan Ct West Fargo, ND 58078
Charleswood NeighborhoodEstimated Value: $618,000 - $680,000
4
Beds
3
Baths
4,156
Sq Ft
$159/Sq Ft
Est. Value
About This Home
This home is located at 2021 Ruttan Ct, West Fargo, ND 58078 and is currently estimated at $660,969, approximately $159 per square foot. 2021 Ruttan Ct is a home located in Cass County with nearby schools including South Elementary School, Cheney Middle School, and West Fargo High School.
Ownership History
Date
Name
Owned For
Owner Type
Purchase Details
Closed on
Dec 1, 2017
Sold by
Sinner Robert B and Sinner Lynette D
Bought by
Stutz Rebecca S and Stutz Michel W
Current Estimated Value
Home Financials for this Owner
Home Financials are based on the most recent Mortgage that was taken out on this home.
Original Mortgage
$470,071
Outstanding Balance
$395,143
Interest Rate
3.88%
Mortgage Type
VA
Estimated Equity
$265,826
Create a Home Valuation Report for This Property
The Home Valuation Report is an in-depth analysis detailing your home's value as well as a comparison with similar homes in the area
Home Values in the Area
Average Home Value in this Area
Purchase History
| Date | Buyer | Sale Price | Title Company |
|---|---|---|---|
| Stutz Rebecca S | -- | None Available |
Source: Public Records
Mortgage History
| Date | Status | Borrower | Loan Amount |
|---|---|---|---|
| Open | Stutz Rebecca S | $470,071 |
Source: Public Records
Tax History Compared to Growth
Tax History
| Year | Tax Paid | Tax Assessment Tax Assessment Total Assessment is a certain percentage of the fair market value that is determined by local assessors to be the total taxable value of land and additions on the property. | Land | Improvement |
|---|---|---|---|---|
| 2024 | $8,222 | $314,050 | $46,400 | $267,650 |
| 2023 | $8,228 | $293,600 | $46,400 | $247,200 |
| 2022 | $8,331 | $284,750 | $46,400 | $238,350 |
| 2021 | $7,878 | $259,500 | $41,500 | $218,000 |
| 2020 | $7,323 | $247,400 | $41,500 | $205,900 |
| 2019 | $6,812 | $235,400 | $41,500 | $193,900 |
| 2018 | $6,473 | $233,500 | $41,500 | $192,000 |
| 2017 | $7,724 | $233,500 | $41,500 | $192,000 |
| 2016 | $7,092 | $227,650 | $41,500 | $186,150 |
| 2015 | $6,663 | $191,000 | $26,450 | $164,550 |
| 2014 | $6,484 | $178,500 | $26,450 | $152,050 |
| 2013 | $6,428 | $171,250 | $26,450 | $144,800 |
Source: Public Records
Map
Nearby Homes
- 2029 Ruttan Ct
- 2014 Ruttan Ct
- 2026 Kenaston Ct
- 1954 Pentland St
- 2037 Ruttan Ct
- 2018 Kenaston Ct
- 1959 Queensbury St
- 2022 Ruttan Ct
- 2034 Kenaston Ct
- 1946 Pentland St
- 2045 Ruttan Ct
- 2030 Ruttan Ct
- 2038 Ruttan Ct
- 1953 Pentland St
- 2042 Kenaston Ct
- 1951 Queensbury St
- 2017 Kenaston Ct
- 1938 Pentland St
- 2046 Ruttan Ct
- 2023 Ruxton Ct