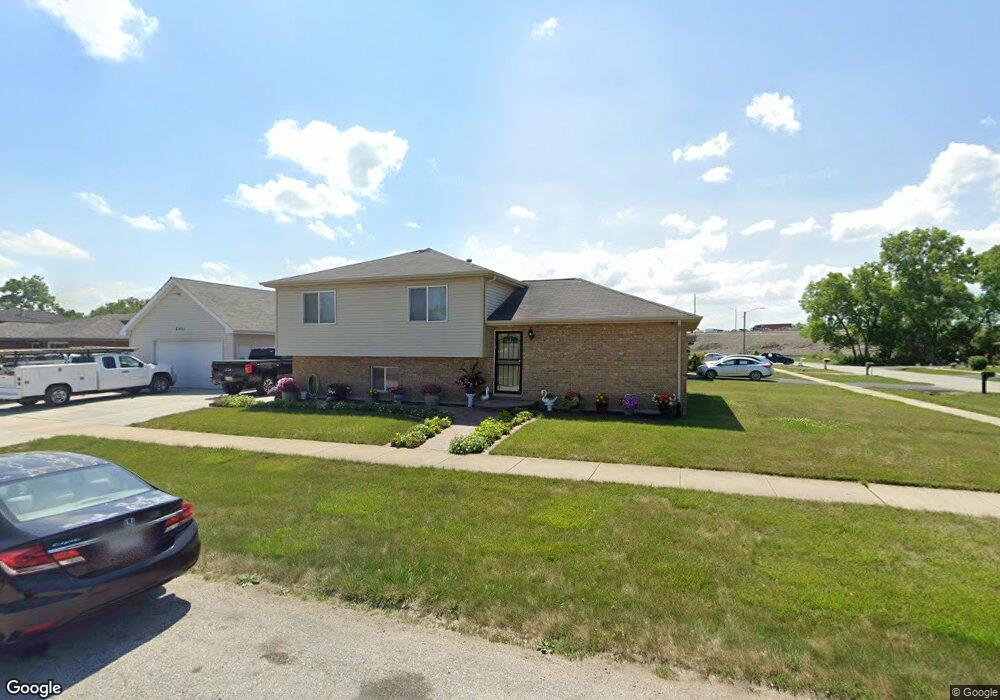
2021 W 142nd St Dixmoor, IL 60426
Estimated Value: $134,000 - $223,000
3
Beds
2
Baths
1,109
Sq Ft
$148/Sq Ft
Est. Value
About This Home
This home is located at 2021 W 142nd St, Dixmoor, IL 60426 and is currently estimated at $164,062, approximately $147 per square foot. 2021 W 142nd St is a home located in Cook County with nearby schools including Thornton Township High School and Academic Mastery Academy.
Ownership History
Date
Name
Owned For
Owner Type
Purchase Details
Closed on
Oct 22, 2021
Sold by
Kls Incorporated
Bought by
Tristar Management Group Llc
Current Estimated Value
Purchase Details
Closed on
Jun 20, 2019
Sold by
Gateway Mortgage Group Llc
Bought by
Kls Incorporated
Purchase Details
Closed on
Sep 25, 2018
Sold by
Burnett Nicki
Bought by
Gateway Mortgage Group Llc
Purchase Details
Closed on
Jun 21, 2011
Sold by
Harris Mickey L and Harris Mickey Lee
Bought by
Nationstar Mortgage Llc
Purchase Details
Closed on
Mar 31, 1995
Sold by
Financial Properties Inc
Bought by
Harris Mickey Lee
Home Financials for this Owner
Home Financials are based on the most recent Mortgage that was taken out on this home.
Original Mortgage
$79,500
Interest Rate
9.25%
Mortgage Type
Purchase Money Mortgage
Create a Home Valuation Report for This Property
The Home Valuation Report is an in-depth analysis detailing your home's value as well as a comparison with similar homes in the area
Home Values in the Area
Average Home Value in this Area
Purchase History
| Date | Buyer | Sale Price | Title Company |
|---|---|---|---|
| Tristar Management Group Llc | -- | Attorney | |
| Kls Incorporated | $45,990 | Attorney | |
| Gateway Mortgage Group Llc | -- | Attorney | |
| Nationstar Mortgage Llc | -- | None Available | |
| Harris Mickey Lee | $84,000 | -- |
Source: Public Records
Mortgage History
| Date | Status | Borrower | Loan Amount |
|---|---|---|---|
| Previous Owner | Harris Mickey Lee | $79,500 |
Source: Public Records
Tax History Compared to Growth
Tax History
| Year | Tax Paid | Tax Assessment Tax Assessment Total Assessment is a certain percentage of the fair market value that is determined by local assessors to be the total taxable value of land and additions on the property. | Land | Improvement |
|---|---|---|---|---|
| 2024 | $2,274 | $8,000 | $781 | $7,219 |
| 2023 | $1,159 | $8,000 | $781 | $7,219 |
| 2022 | $1,159 | $3,823 | $781 | $3,042 |
| 2021 | $1,150 | $3,823 | $781 | $3,042 |
| 2020 | $1,162 | $3,823 | $781 | $3,042 |
| 2019 | $1,678 | $4,894 | $703 | $4,191 |
| 2018 | $1,644 | $4,894 | $703 | $4,191 |
| 2017 | $1,645 | $4,894 | $703 | $4,191 |
| 2016 | $1,526 | $4,308 | $625 | $3,683 |
| 2015 | $1,461 | $4,308 | $625 | $3,683 |
| 2014 | $1,267 | $4,308 | $625 | $3,683 |
| 2013 | $2,073 | $4,701 | $625 | $4,076 |
Source: Public Records
Map
Nearby Homes
- 14245 Lincoln Ave
- 14514 Cooper Ave
- 14247 Davis Ct
- 14564 Spaulding Ave
- 14525 Oakley St
- 14727 Wood St
- 2004 139th St
- 14806 Lincoln Ave
- 14826 Robey Ave
- 14505 S Mckinley Ave
- 14337 S Mckinley Ave
- 14839 Cooper Ave
- 13809 Seeley Ave
- 14902 Robey Ave
- 14715 Maplewood Ave
- 14601 S Palmer Ave
- 14719 Maplewood Ave
- 14807 Paulina St
- 14533 Myrtle Ave
- 14543 Myrtle Ave
- 2021 W 142nd St
- 2021 W 142nd St
- 2035 W 142nd St
- 2029 W 142nd St
- 2029 W 142nd St
- 14204 Seeley Ave
- 14204 Seeley Ave
- 2017 W 142nd St
- 2017 W 142nd St
- 2033 W 142nd St
- 14208 Seeley Ave
- 14208 Seeley Ave
- 2240 W 142nd St
- 14212 Seeley Ave
- 14212 Seeley Ave
- 2242 W 142nd St
- 14203 Hoyne Ave
- 14203 Hoyne Ave
- 2037 W 142nd St
- 2037 W 142nd St