
Landlord's Agent in 2016
Norval Peabody
Peabody Real Estate LLC
(703) 436-6964
20 Total Sales
Estimated Value: $1,198,000 - $1,493,000
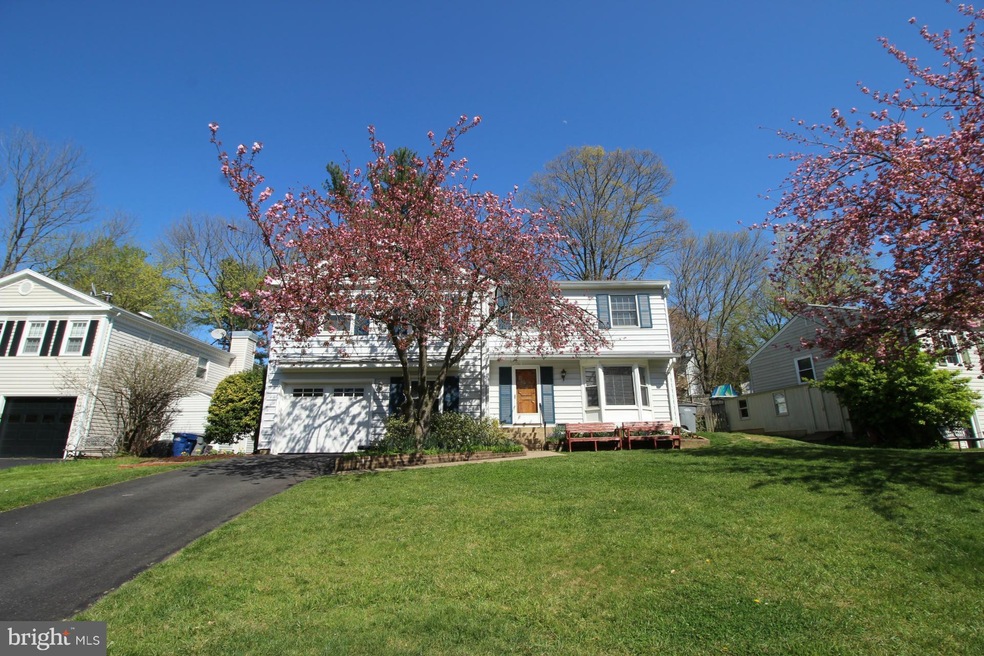
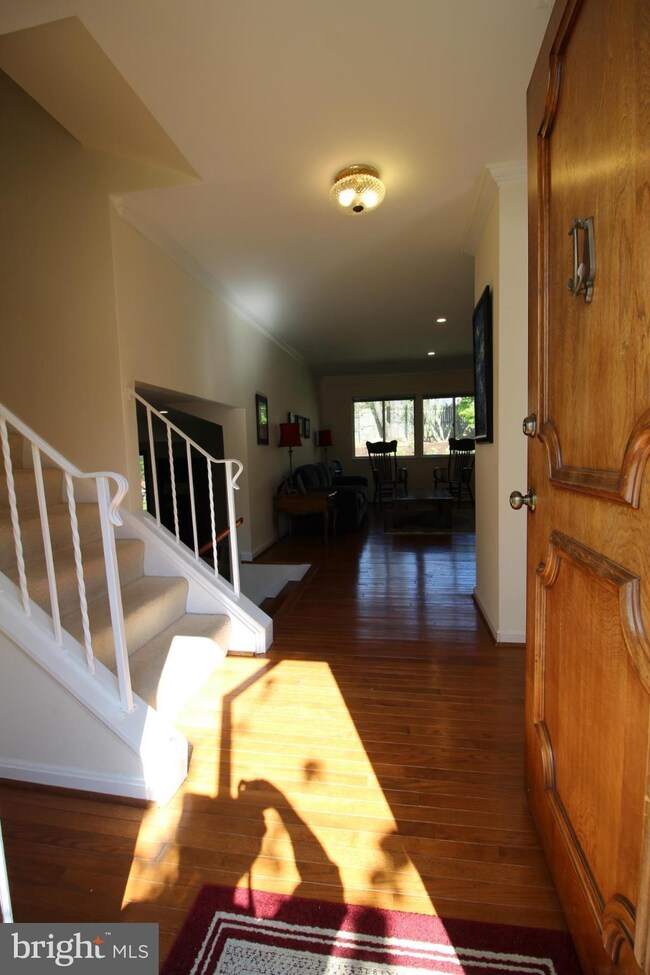
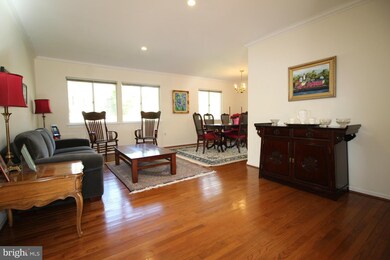
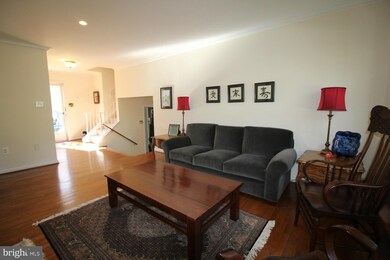
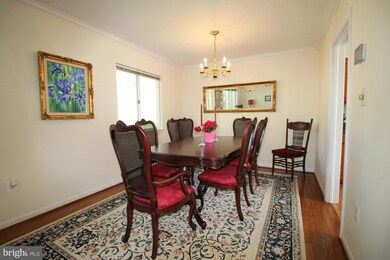
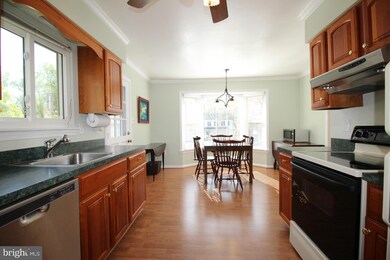
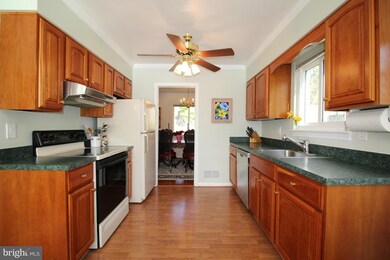
4-level bright expanded split home on McLean/Falls Church border. Cul-de-sac, quiet location. 4 bed 3.5 baths. Master retreat with sitting room on new top lvl incl bath & walk-in, Large dining and living rooms, eat in kitchen with pantry and bay window in eating area. Recreation room with fireplace, sliding doors on bottom level to back yard. Stone walls in back and new in front. McLean schools.
Last Agent to Rent the Property
(703) 436-6964 info@peabodyresidential.com Peabody Real Estate LLC Listed on: 04/18/2016
Last Renter's Agent
Cherie Jolly
cherieandjavi@gmail.com RE/MAX Executives License #MRIS:3097901
| Date | Buyer | Sale Price | Title Company |
|---|---|---|---|
| Park Marvin | -- | None Available | |
| Park Marvin J | $800,000 | -- | |
| Owens Tr Richard T | -- | -- | |
| Owens Tr Richard T | -- | -- | |
| Richard Thomas Owens Rev Trust | -- | -- |
| Date | Status | Borrower | Loan Amount |
|---|---|---|---|
| Previous Owner | Park Marvin J | $680,000 |
| Date | Event | Price | List to Sale | Price per Sq Ft | Prior Sale |
|---|---|---|---|---|---|
| 06/19/2016 06/19/16 | Rented | $3,600 | 0.0% | -- | |
| 04/26/2016 04/26/16 | Under Contract | -- | -- | -- | |
| 04/18/2016 04/18/16 | For Rent | $3,600 | 0.0% | -- | |
| 07/01/2014 07/01/14 | Sold | $800,000 | +0.1% | $279 / Sq Ft | View Prior Sale |
| 05/19/2014 05/19/14 | Pending | -- | -- | -- | |
| 05/15/2014 05/15/14 | For Sale | $799,000 | -0.1% | $279 / Sq Ft | |
| 05/15/2014 05/15/14 | Off Market | $800,000 | -- | -- |
| Year | Tax Paid | Tax Assessment Tax Assessment Total Assessment is a certain percentage of the fair market value that is determined by local assessors to be the total taxable value of land and additions on the property. | Land | Improvement |
|---|---|---|---|---|
| 2025 | $12,950 | $1,097,020 | $583,000 | $514,020 |
| 2024 | $12,950 | $1,049,130 | $572,000 | $477,130 |
| 2023 | $13,897 | $1,164,300 | $572,000 | $592,300 |
| 2022 | $11,859 | $975,950 | $477,000 | $498,950 |
| 2021 | $11,334 | $913,820 | $454,000 | $459,820 |
| 2020 | $11,671 | $936,660 | $454,000 | $482,660 |
| 2019 | $10,619 | $848,270 | $454,000 | $394,270 |
| 2018 | $9,428 | $819,790 | $437,000 | $382,790 |
| 2017 | $10,051 | $819,790 | $437,000 | $382,790 |
| 2016 | $9,942 | $812,280 | $437,000 | $375,280 |
| 2015 | $9,324 | $788,350 | $424,000 | $364,350 |
| 2014 | -- | $768,060 | $412,000 | $356,060 |
Landlord's Agent in 2016
Norval Peabody
Peabody Real Estate LLC
(703) 436-6964
20 Total Sales
C
Tenant's Agent in 2016
Cherie Jolly
RE/MAX
Seller's Agent in 2014
Jake Sullivan
RE/MAX
(703) 966-1936
29 in this area
57 Total Sales
M
Buyer's Agent in 2014
Mary Jane Kline
McEnearney Associates
Source: Bright MLS
MLS Number: 1001935875
APN: 0402-27-0061
Disclaimer: Certain information contained herein is derived from information provided by parties other than Homes.com. All information provided is deemed reliable, but is not guaranteed to be accurate and should be independently verified.
![]() The data relating to real estate for sale on this website appears in part through the BRIGHT Internet Data Exchange program, a voluntary cooperative exchange of property listing data between licensed real estate brokerage firms, and is provided by BRIGHT through a licensing agreement.
The data relating to real estate for sale on this website appears in part through the BRIGHT Internet Data Exchange program, a voluntary cooperative exchange of property listing data between licensed real estate brokerage firms, and is provided by BRIGHT through a licensing agreement.
Listing information is from various brokers who participate in the Bright MLS IDX program and not all listings may be visible on the site.
The property information being provided on or through the website is for the personal, non-commercial use of consumers and such information may not be used for any purpose other than to identify prospective properties consumers may be interested in purchasing.
Some properties which appear for sale on the website may no longer be available because they are for instance, under contract, sold or are no longer being offered for sale.
Property information displayed is deemed reliable but is not guaranteed.
Copyright 2025 Bright MLS, Inc.