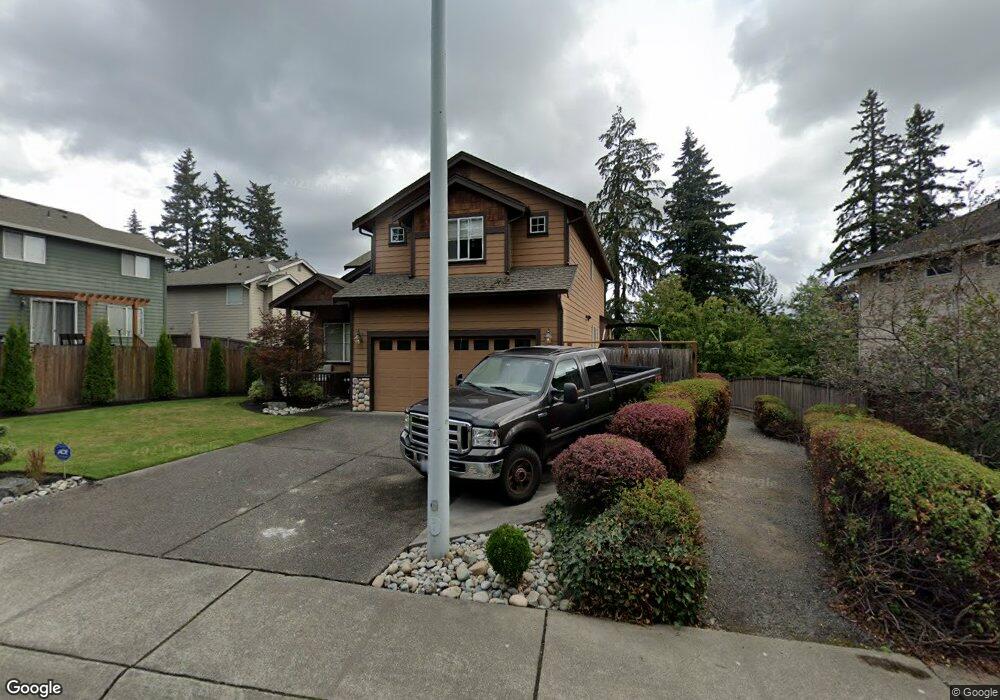
20213 Bartlett Rd Bothell, WA 98012
Queensborough-Brentwood NeighborhoodEstimated Value: $1,000,564 - $1,141,000
3
Beds
3
Baths
2,142
Sq Ft
$501/Sq Ft
Est. Value
About This Home
This home is located at 20213 Bartlett Rd, Bothell, WA 98012 and is currently estimated at $1,072,641, approximately $500 per square foot. 20213 Bartlett Rd is a home located in Snohomish County with nearby schools including Frank Love Elementary School, Kenmore Middle School, and Bothell High School.
Ownership History
Date
Name
Owned For
Owner Type
Purchase Details
Closed on
Feb 28, 2006
Sold by
Price David H
Bought by
Farag Sharif
Current Estimated Value
Home Financials for this Owner
Home Financials are based on the most recent Mortgage that was taken out on this home.
Original Mortgage
$25,000
Outstanding Balance
$19,483
Interest Rate
6.08%
Mortgage Type
Credit Line Revolving
Estimated Equity
$1,053,158
Purchase Details
Closed on
Dec 7, 2004
Sold by
Sullivan Price Colleen M
Bought by
Price David H
Home Financials for this Owner
Home Financials are based on the most recent Mortgage that was taken out on this home.
Original Mortgage
$271,200
Interest Rate
5.12%
Mortgage Type
Purchase Money Mortgage
Purchase Details
Closed on
May 1, 2002
Sold by
Select Homes Inc
Bought by
Price David H and Sullivan Price Colleen M
Home Financials for this Owner
Home Financials are based on the most recent Mortgage that was taken out on this home.
Original Mortgage
$242,360
Interest Rate
7.18%
Create a Home Valuation Report for This Property
The Home Valuation Report is an in-depth analysis detailing your home's value as well as a comparison with similar homes in the area
Home Values in the Area
Average Home Value in this Area
Purchase History
| Date | Buyer | Sale Price | Title Company |
|---|---|---|---|
| Farag Sharif | $418,000 | Fidelity National Title | |
| Price David H | $11,235 | Fidelity National Title | |
| Price David H | $302,950 | -- |
Source: Public Records
Mortgage History
| Date | Status | Borrower | Loan Amount |
|---|---|---|---|
| Open | Farag Sharif | $25,000 | |
| Open | Farag Sharif | $333,000 | |
| Previous Owner | Price David H | $271,200 | |
| Previous Owner | Price David H | $242,360 | |
| Closed | Price David H | $45,443 | |
| Closed | Price David H | $33,900 |
Source: Public Records
Tax History
| Year | Tax Paid | Tax Assessment Tax Assessment Total Assessment is a certain percentage of the fair market value that is determined by local assessors to be the total taxable value of land and additions on the property. | Land | Improvement |
|---|---|---|---|---|
| 2025 | $7,019 | $855,100 | $505,600 | $349,500 |
| 2024 | $7,019 | $824,100 | $486,700 | $337,400 |
| 2023 | $7,388 | $939,000 | $555,000 | $384,000 |
| 2022 | $6,558 | $667,700 | $341,700 | $326,000 |
| 2020 | $5,978 | $547,700 | $262,900 | $284,800 |
| 2019 | $5,501 | $508,400 | $217,000 | $291,400 |
| 2018 | $5,201 | $452,900 | $190,000 | $262,900 |
| 2017 | $4,571 | $401,300 | $155,800 | $245,500 |
| 2016 | $4,388 | $375,700 | $140,500 | $235,200 |
Source: Public Records
Map
Nearby Homes
- 105 202nd St SE
- 24 199th Place SE
- 130 203rd Place SW
- 110 204th Place SW
- 429 203rd Place SE
- 19726 Filbert Dr
- 309 207th Place SE
- 20231 4th Place W
- 618 203rd St SE
- 300 208th St SE
- 20029 7th Ave SE
- 20911 W Richmond Rd
- 20902 2nd Ave W
- 20912 2nd Ave W
- 820 Grimes Rd
- 727 198th Place SE
- 21120 Meridian Place W
- 215 Hubbard Rd
- 20511 Greening Rd
- 610 Logan Rd
- 20219 Bartlett Rd
- 102 202nd St SE
- 104 202nd St SE
- 106 202nd St SE
- 103 203rd St SE
- 112 202nd St SE
- 105 203rd St SE
- 120 202nd St SE
- 107 203rd St SE
- 103 202nd St SE
- 101 202nd St SE
- 107 202nd St SE
- 124 202nd St SE
- 104 203rd St SE
- 109 203rd St SE
- 111 202nd St SE
- 117 202nd St SE
- 20123 Bartlett Rd
- 111 203rd St SE
- 121 202nd St SE
Your Personal Tour Guide
Ask me questions while you tour the home.