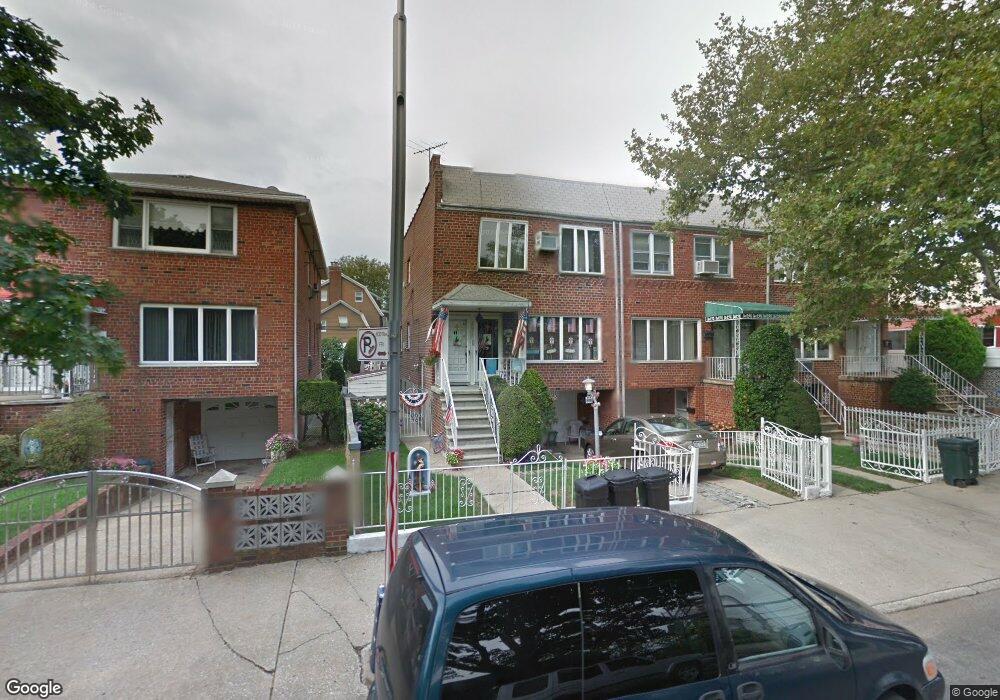
2022 57th St Brooklyn, NY 11204
Borough Park NeighborhoodEstimated Value: $1,551,058 - $2,321,000
--
Bed
--
Bath
2,854
Sq Ft
$729/Sq Ft
Est. Value
About This Home
This home is located at 2022 57th St, Brooklyn, NY 11204 and is currently estimated at $2,081,765, approximately $729 per square foot. 2022 57th St is a home located in Kings County with nearby schools including P.S. 121 Nelson A Rockefeller, Franklin Delano Roosevelt High School, and Bais Yaakov D'Gur High School.
Ownership History
Date
Name
Owned For
Owner Type
Purchase Details
Closed on
Jul 8, 2025
Sold by
Deam M Longo Sr As Administrator and Foti
Bought by
Katz Isaac and Katz Menucha Rachel
Current Estimated Value
Home Financials for this Owner
Home Financials are based on the most recent Mortgage that was taken out on this home.
Original Mortgage
$1,175,000
Outstanding Balance
$1,172,979
Interest Rate
6.77%
Mortgage Type
Purchase Money Mortgage
Estimated Equity
$908,786
Create a Home Valuation Report for This Property
The Home Valuation Report is an in-depth analysis detailing your home's value as well as a comparison with similar homes in the area
Home Values in the Area
Average Home Value in this Area
Purchase History
| Date | Buyer | Sale Price | Title Company |
|---|---|---|---|
| Katz Isaac | $2,200,000 | -- |
Source: Public Records
Mortgage History
| Date | Status | Borrower | Loan Amount |
|---|---|---|---|
| Open | Katz Isaac | $1,175,000 |
Source: Public Records
Tax History Compared to Growth
Tax History
| Year | Tax Paid | Tax Assessment Tax Assessment Total Assessment is a certain percentage of the fair market value that is determined by local assessors to be the total taxable value of land and additions on the property. | Land | Improvement |
|---|---|---|---|---|
| 2025 | $10,100 | $118,980 | $24,420 | $94,560 |
| 2024 | $10,100 | $93,960 | $24,420 | $69,540 |
| 2023 | $10,325 | $114,900 | $24,420 | $90,480 |
| 2022 | $9,998 | $96,780 | $24,420 | $72,360 |
| 2021 | $9,942 | $92,040 | $24,420 | $67,620 |
| 2020 | $7,456 | $85,260 | $24,420 | $60,840 |
| 2019 | $8,770 | $67,800 | $24,420 | $43,380 |
| 2018 | $3,935 | $45,072 | $12,547 | $32,525 |
| 2017 | $3,889 | $44,493 | $13,855 | $30,638 |
| 2016 | $3,575 | $41,976 | $16,848 | $25,128 |
| 2015 | $2,093 | $39,813 | $23,962 | $15,851 |
| 2014 | $2,093 | $37,560 | $27,120 | $10,440 |
Source: Public Records
Map
Nearby Homes