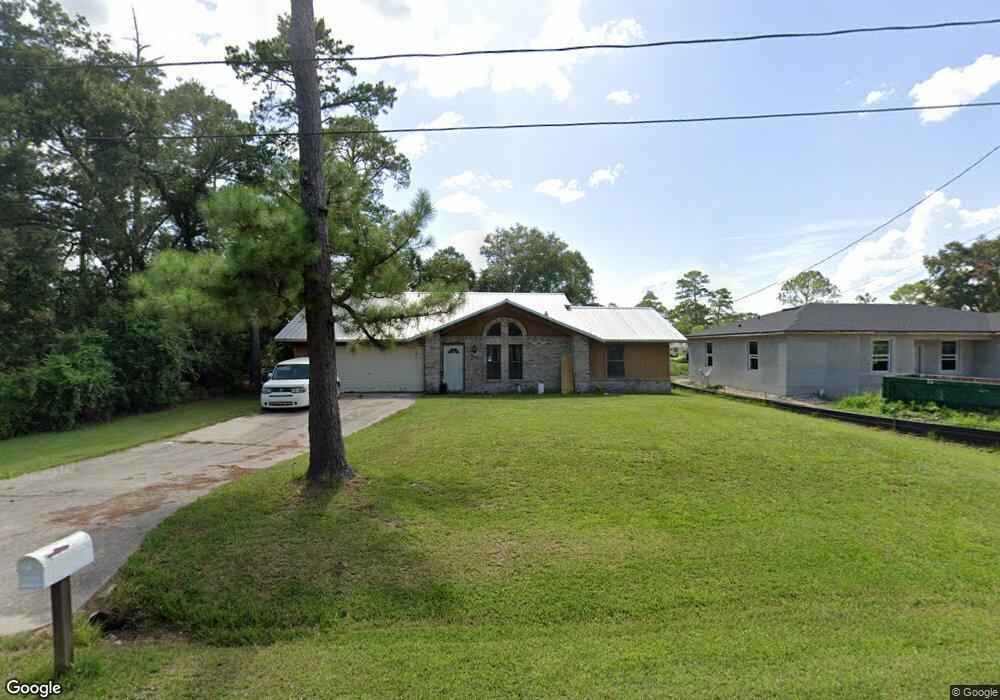
2022 8th Ave Deland, FL 32724
Estimated Value: $238,000 - $284,000
3
Beds
2
Baths
1,479
Sq Ft
$175/Sq Ft
Est. Value
About This Home
This home is located at 2022 8th Ave, Deland, FL 32724 and is currently estimated at $258,916, approximately $175 per square foot. 2022 8th Ave is a home located in Volusia County with nearby schools including Deland High School, George W. Marks Elementary School, and Deland Middle School.
Ownership History
Date
Name
Owned For
Owner Type
Purchase Details
Closed on
Oct 28, 2021
Sold by
Roberts Kevin J and Roberts Anh N
Bought by
Faul Wayne and Kelder Megan
Current Estimated Value
Home Financials for this Owner
Home Financials are based on the most recent Mortgage that was taken out on this home.
Original Mortgage
$118,700
Outstanding Balance
$108,478
Interest Rate
2.8%
Mortgage Type
New Conventional
Estimated Equity
$150,438
Purchase Details
Closed on
Nov 12, 2015
Sold by
Roberts Kevin J and Roberts Anh N
Bought by
Roberts Family Living Trust
Purchase Details
Closed on
Jan 10, 1997
Sold by
Haynes James A and Haynes Debbie Jo
Bought by
Roberts Kevin J and Roberts Anh N
Purchase Details
Closed on
Mar 15, 1992
Bought by
Roberts Kevin J Tr
Purchase Details
Closed on
Dec 15, 1990
Bought by
Roberts Kevin J Tr
Purchase Details
Closed on
Nov 15, 1989
Bought by
Roberts Kevin J Tr
Purchase Details
Closed on
Aug 15, 1989
Bought by
Roberts Kevin J Tr
Create a Home Valuation Report for This Property
The Home Valuation Report is an in-depth analysis detailing your home's value as well as a comparison with similar homes in the area
Home Values in the Area
Average Home Value in this Area
Purchase History
| Date | Buyer | Sale Price | Title Company |
|---|---|---|---|
| Faul Wayne | $125,000 | Southern Title Hldg Co Llc | |
| Roberts Family Living Trust | -- | Attorney | |
| Roberts Kevin J | $85,250 | -- | |
| Roberts Kevin J Tr | $100 | -- | |
| Roberts Kevin J Tr | $100 | -- | |
| Roberts Kevin J Tr | $54,700 | -- | |
| Roberts Kevin J Tr | $3,500 | -- |
Source: Public Records
Mortgage History
| Date | Status | Borrower | Loan Amount |
|---|---|---|---|
| Open | Faul Wayne | $118,700 |
Source: Public Records
Tax History Compared to Growth
Tax History
| Year | Tax Paid | Tax Assessment Tax Assessment Total Assessment is a certain percentage of the fair market value that is determined by local assessors to be the total taxable value of land and additions on the property. | Land | Improvement |
|---|---|---|---|---|
| 2025 | $2,786 | $189,516 | -- | -- |
| 2024 | $2,786 | $184,175 | -- | -- |
| 2023 | $2,786 | $178,811 | $0 | $0 |
| 2022 | $2,724 | $173,603 | $19,125 | $154,478 |
| 2021 | $2,849 | $145,393 | $13,500 | $131,893 |
| 2020 | $2,670 | $140,241 | $7,875 | $132,366 |
| 2019 | $2,603 | $128,494 | $7,875 | $120,619 |
| 2018 | $2,429 | $115,557 | $5,625 | $109,932 |
| 2017 | $2,279 | $104,362 | $4,500 | $99,862 |
| 2016 | $2,009 | $88,643 | $0 | $0 |
| 2015 | $1,932 | $85,010 | $0 | $0 |
| 2014 | $1,757 | $74,231 | $0 | $0 |
Source: Public Records
Map
Nearby Homes
- 2036 8th Ave
- 2023 Central Pkwy
- 1990 8th Ave
- 2047 Central Pkwy
- 2052 8th Ave
- 1980 8th Ave
- 2718 Evergreen Rd
- 0 Central Pkwy Unit V4723272
- 0 Central Pkwy Unit V4723270
- 0 Central Pkwy Unit O5551306
- 0 Central Pkwy Unit V4721679
- 0 Central Pkwy Unit V4719491
- 2055 Central Pkwy
- 2650 Evergreen Rd
- 2740 Evergreen Rd
- 1972 8th Ave
- 2020 9th Ave
- 2075 Central Pkwy
- 1975 8th Ave
- 2090 8th Ave