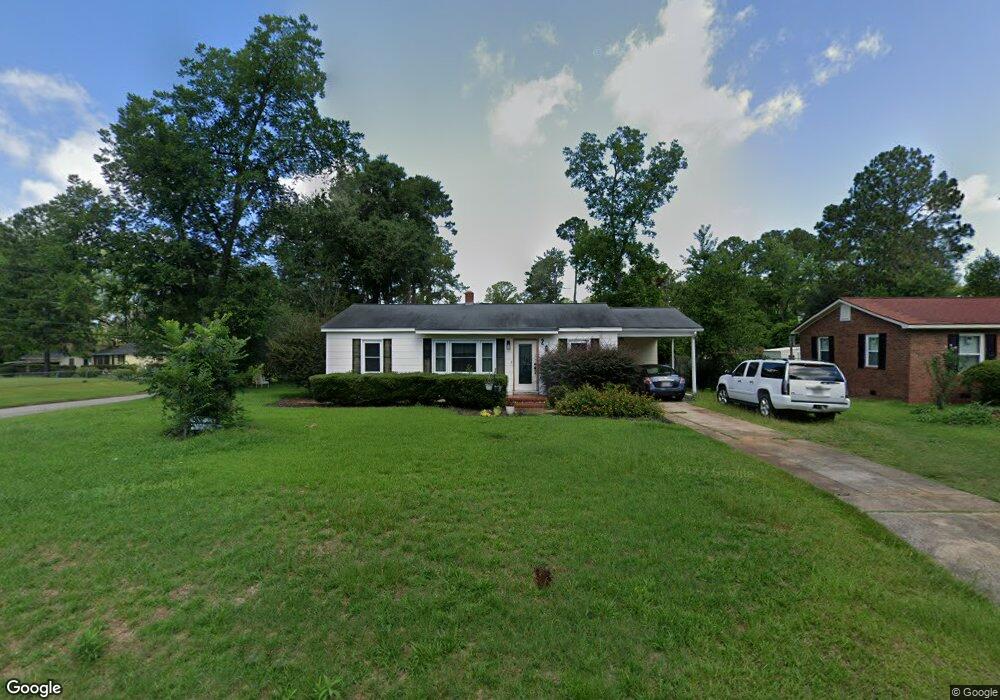
2022 Melrose Dr Albany, GA 31707
Estimated Value: $66,162 - $95,000
3
Beds
1
Bath
1,053
Sq Ft
$77/Sq Ft
Est. Value
About This Home
This home is located at 2022 Melrose Dr, Albany, GA 31707 and is currently estimated at $80,791, approximately $76 per square foot. 2022 Melrose Dr is a home located in Dougherty County with nearby schools including Live Oak Elementary School, Merry Acres Middle School, and Westover High School.
Ownership History
Date
Name
Owned For
Owner Type
Purchase Details
Closed on
May 18, 2007
Sold by
Sedberry Mark A
Bought by
Davis Joel and Davis Marlina D
Current Estimated Value
Home Financials for this Owner
Home Financials are based on the most recent Mortgage that was taken out on this home.
Original Mortgage
$64,000
Outstanding Balance
$38,823
Interest Rate
6.12%
Mortgage Type
New Conventional
Estimated Equity
$41,968
Purchase Details
Closed on
Apr 18, 1997
Sold by
Kabo Enterprises
Bought by
Sedberry Mark A and Sedberry Sonja
Purchase Details
Closed on
Jun 27, 1996
Sold by
W E Harmon Liquidating Llc
Bought by
Kabo Enterprises
Purchase Details
Closed on
Oct 1, 1995
Sold by
Amos Margaret Harman Etal
Bought by
Harmon W E Liquidating Llc
Purchase Details
Closed on
Sep 30, 1995
Sold by
Harmon Wlater Elmo By Ex & Trustee
Bought by
Amos Margaret Harman Harman Jesse A
Purchase Details
Closed on
Mar 21, 1964
Sold by
Downs Alva C
Bought by
Harmon W E
Create a Home Valuation Report for This Property
The Home Valuation Report is an in-depth analysis detailing your home's value as well as a comparison with similar homes in the area
Home Values in the Area
Average Home Value in this Area
Purchase History
| Date | Buyer | Sale Price | Title Company |
|---|---|---|---|
| Davis Joel | $64,000 | -- | |
| Sedberry Mark A | $45,000 | -- | |
| Kabo Enterprises | $282,000 | -- | |
| Harmon W E Liquidating Llc | -- | -- | |
| Amos Margaret Harman Harman Jesse A | -- | -- | |
| Harmon W E | -- | -- |
Source: Public Records
Mortgage History
| Date | Status | Borrower | Loan Amount |
|---|---|---|---|
| Open | Davis Joel | $64,000 |
Source: Public Records
Tax History Compared to Growth
Tax History
| Year | Tax Paid | Tax Assessment Tax Assessment Total Assessment is a certain percentage of the fair market value that is determined by local assessors to be the total taxable value of land and additions on the property. | Land | Improvement |
|---|---|---|---|---|
| 2024 | $750 | $15,720 | $4,000 | $11,720 |
| 2023 | $732 | $15,720 | $4,000 | $11,720 |
| 2022 | $735 | $15,720 | $4,000 | $11,720 |
| 2021 | $682 | $15,720 | $4,000 | $11,720 |
| 2020 | $683 | $15,720 | $4,000 | $11,720 |
| 2019 | $686 | $15,720 | $4,000 | $11,720 |
| 2018 | $689 | $15,720 | $4,000 | $11,720 |
| 2017 | $641 | $15,720 | $4,000 | $11,720 |
| 2016 | $642 | $15,720 | $4,000 | $11,720 |
| 2015 | $644 | $15,720 | $4,000 | $11,720 |
| 2014 | $636 | $15,720 | $4,000 | $11,720 |
Source: Public Records
Map
Nearby Homes
- 2026 Melrose Dr
- 2021 W Broad Ave
- 200 N Ingleside Dr
- 1821 Samford Ave
- 2009 W Broad Ave
- 100 N Ingleside Dr
- 1916 W Broad Ave
- 612 Russell Rd
- 608 Russell Rd
- 2200 Gillionville Rd
- 1926 W Oglethorpe Ave
- 00 Gillionville Rd
- 1711 Parker Ave
- 1710 Myrtle Rd
- 1640 N Valencia Dr
- 410 Pinecrest Dr
- 1703 W Oglethorpe Ave
- 1810 Edgerly Ave
- 1906 W Whitney Ave
- 1804 W Whitney Ave
- 2024 Melrose Dr
- 2018 Melrose Dr
- 2029 W Broad Ave
- 2031 W Broad Ave
- 2023 Melrose Dr
- 2025 Melrose Dr
- 2027 W Broad Ave
- 2016 Melrose Dr
- 2033 W Broad Ave
- 2028 Melrose Dr
- 2019 Melrose Dr
- 2027 Melrose Dr
- 2035 W Broad Ave
- 2025 W Broad Ave
- 2017 Melrose Dr
- 2014 Melrose Dr
- 2029 Melrose Dr
- 2023 W Broad Ave
- 2015 Melrose Dr
- 303 N Ingleside Dr