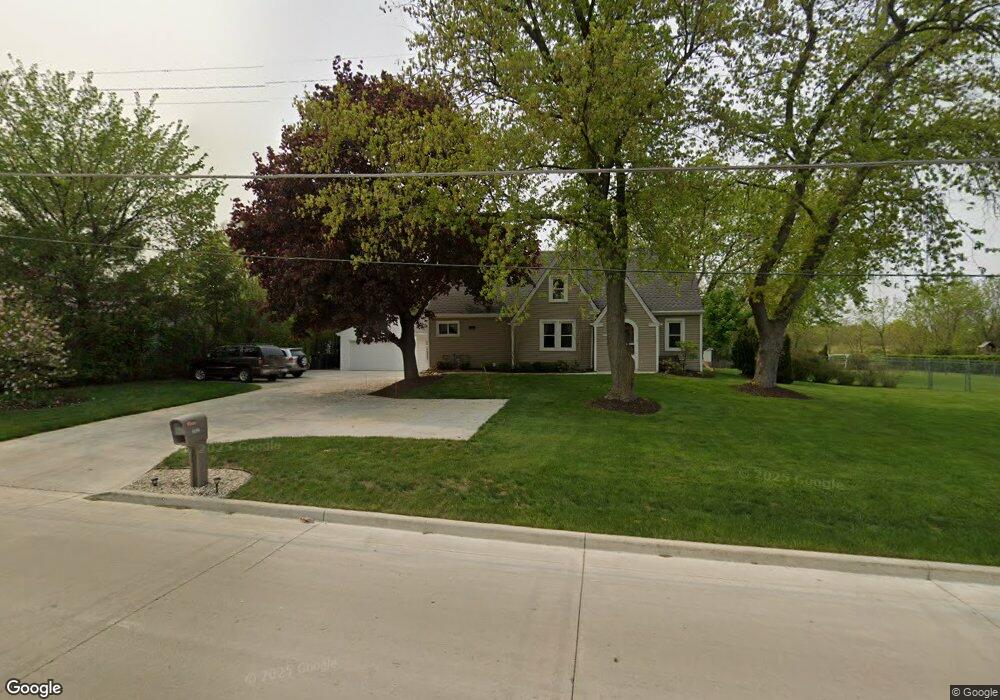
2022 N Green Bay Rd Mount Pleasant, WI 53405
Estimated Value: $208,000 - $344,000
3
Beds
1
Bath
1,818
Sq Ft
$164/Sq Ft
Est. Value
About This Home
This home is located at 2022 N Green Bay Rd, Mount Pleasant, WI 53405 and is currently estimated at $297,929, approximately $163 per square foot. 2022 N Green Bay Rd is a home located in Racine County with nearby schools including Gifford Elementary School, Case High School, and Racine Christian School.
Ownership History
Date
Name
Owned For
Owner Type
Purchase Details
Closed on
May 1, 2012
Sold by
Us Bank Na
Bought by
Mora Luis and Mora Ignacia Munoz De
Current Estimated Value
Home Financials for this Owner
Home Financials are based on the most recent Mortgage that was taken out on this home.
Original Mortgage
$74,073
Interest Rate
3.87%
Mortgage Type
FHA
Purchase Details
Closed on
May 9, 2011
Sold by
Bloom Sara W and Bloom Donald L
Bought by
Us Bank Na and Sasco Mortgage Loan Trust 2007 Rnpi
Purchase Details
Closed on
Aug 11, 2005
Sold by
Wyma Sara A
Bought by
Bloom Sara W and Bloom Donald L
Home Financials for this Owner
Home Financials are based on the most recent Mortgage that was taken out on this home.
Original Mortgage
$169,150
Interest Rate
5.8%
Mortgage Type
New Conventional
Create a Home Valuation Report for This Property
The Home Valuation Report is an in-depth analysis detailing your home's value as well as a comparison with similar homes in the area
Home Values in the Area
Average Home Value in this Area
Purchase History
| Date | Buyer | Sale Price | Title Company |
|---|---|---|---|
| Mora Luis | $77,500 | None Available | |
| Us Bank Na | -- | None Available | |
| Bloom Sara W | $155,790 | -- |
Source: Public Records
Mortgage History
| Date | Status | Borrower | Loan Amount |
|---|---|---|---|
| Previous Owner | Mora Luis | $74,073 | |
| Previous Owner | Bloom Sara W | $169,150 |
Source: Public Records
Tax History Compared to Growth
Tax History
| Year | Tax Paid | Tax Assessment Tax Assessment Total Assessment is a certain percentage of the fair market value that is determined by local assessors to be the total taxable value of land and additions on the property. | Land | Improvement |
|---|---|---|---|---|
| 2024 | $3,636 | $223,700 | $65,700 | $158,000 |
| 2023 | $3,361 | $199,500 | $61,300 | $138,200 |
| 2022 | $3,202 | $189,800 | $61,300 | $128,500 |
| 2021 | $3,288 | $173,200 | $55,700 | $117,500 |
| 2020 | $3,895 | $155,000 | $49,100 | $105,900 |
| 2019 | $2,873 | $155,000 | $49,100 | $105,900 |
| 2018 | $2,161 | $108,700 | $48,600 | $60,100 |
| 2017 | $2,274 | $113,300 | $48,600 | $64,700 |
| 2016 | $2,445 | $112,700 | $42,100 | $70,600 |
| 2015 | $2,347 | $112,700 | $42,100 | $70,600 |
| 2014 | $2,218 | $112,700 | $42,100 | $70,600 |
| 2013 | $2,376 | $112,700 | $42,100 | $70,600 |
Source: Public Records
Map
Nearby Homes
- 2116 N Green Bay Rd
- 4919 Flambeau Dr
- 4940 Flambeau Dr
- 1505 Country Club Dr Unit 22
- 3923 Frances Dr
- 2536 Green Haze Ave
- 1418 Meadowbrook Blvd
- 2132 Esquire Ln
- 5402 Cynthia Ln
- 2904 Old Mill Dr Unit B3
- 4723 Shirley Ave
- 2746 Manor Ave
- 27 Oregon St
- 3810 Spring St
- 5740 Cambridge Ln Unit 3
- 5835 Cambridge Cir Unit 5
- 5616 Cambridge Ln Unit 5
- 5740 Cambridge Ln Unit 1
- 5820 Cambridge Ln Unit 7
- 1447 Windsor Way Unit 3
- 2010 N Green Bay Rd
- 2038 N Green Bay Rd
- 2009 N Green Bay Rd
- 2046 N Green Bay Rd
- 2017 N Green Bay Rd
- 2023 N Green Bay Rd
- 2001 N Green Bay Rd
- 2037 N Green Bay Rd
- 1946 N Green Bay Rd
- 2058 N Green Bay Rd
- 1943 N Green Bay Rd
- 2045 N Green Bay Rd
- 1934 N Green Bay Rd
- 2015 Ole Davidson Rd Unit 2015
- 2108 N Green Bay Rd
- 1935 N Green Bay Rd
- 2101 N Green Bay Rd
- 1927 N Green Bay Rd
- 2121 Ole Davidson Rd
- 2121 Ole Davidson Rd Unit 2121