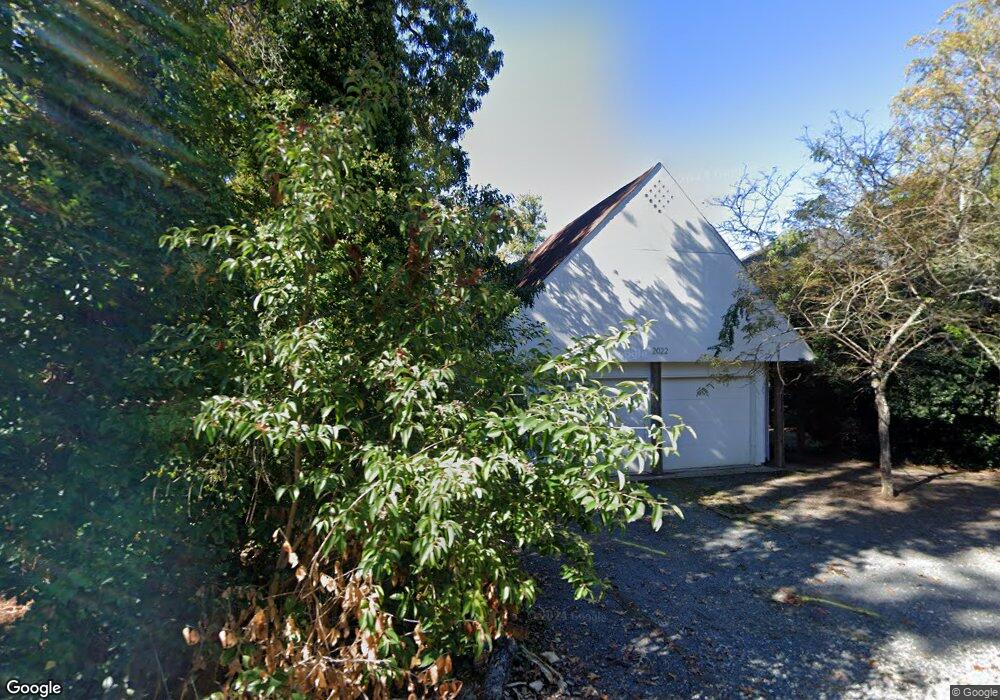
2022 Peppercorn Ln Charlotte, NC 28205
Plaza Midwood NeighborhoodEstimated Value: $1,084,000 - $1,414,000
3
Beds
3
Baths
3,037
Sq Ft
$405/Sq Ft
Est. Value
About This Home
This home is located at 2022 Peppercorn Ln, Charlotte, NC 28205 and is currently estimated at $1,231,453, approximately $405 per square foot. 2022 Peppercorn Ln is a home located in Mecklenburg County with nearby schools including Shamrock Gardens Elementary School, Eastway Middle School, and Garinger High School.
Ownership History
Date
Name
Owned For
Owner Type
Purchase Details
Closed on
Jul 30, 2025
Sold by
William Murray Whisnant Revocable Inter and Posey Frances Kathleen
Bought by
Posey Frances Kathleen
Current Estimated Value
Purchase Details
Closed on
Oct 6, 2016
Sold by
Whisnant William Murray and Posey Frances Kathleen
Bought by
Whisnant William Murray and William Murray Whisnant Revocable Inter
Purchase Details
Closed on
Mar 10, 2016
Sold by
Vanhoozier Scotty L and Collins Benjamin Keith
Bought by
Sage Peppers Development Company Llc
Purchase Details
Closed on
Sep 7, 2007
Sold by
Mauldin Billy Edward and Mauldin Julie T
Bought by
The Jewell Corp
Purchase Details
Closed on
Sep 6, 2007
Sold by
Whisnant Kathleen P
Bought by
Mauldin Billy and Mauldin Julie
Purchase Details
Closed on
Aug 31, 2007
Sold by
Whisnant Murray
Bought by
Mauldin Billy and Mauldin Julie
Purchase Details
Closed on
Apr 21, 1997
Bought by
Whisnant Murray
Create a Home Valuation Report for This Property
The Home Valuation Report is an in-depth analysis detailing your home's value as well as a comparison with similar homes in the area
Home Values in the Area
Average Home Value in this Area
Purchase History
| Date | Buyer | Sale Price | Title Company |
|---|---|---|---|
| Posey Frances Kathleen | -- | None Listed On Document | |
| Posey Frances Kathleen | -- | None Listed On Document | |
| Whisnant William Murray | -- | None Available | |
| Sage Peppers Development Company Llc | $320,000 | None Available | |
| The Jewell Corp | $400,000 | None Available | |
| Mauldin Billy | -- | None Available | |
| Mauldin Billy | $3,000 | None Available | |
| Whisnant Murray | $56,000 | -- |
Source: Public Records
Tax History Compared to Growth
Tax History
| Year | Tax Paid | Tax Assessment Tax Assessment Total Assessment is a certain percentage of the fair market value that is determined by local assessors to be the total taxable value of land and additions on the property. | Land | Improvement |
|---|---|---|---|---|
| 2025 | $6,326 | $815,200 | $320,000 | $495,200 |
| 2024 | $6,326 | $815,200 | $320,000 | $495,200 |
| 2023 | $6,326 | $815,200 | $320,000 | $495,200 |
| 2022 | $5,377 | $544,200 | $280,000 | $264,200 |
| 2021 | $5,366 | $544,200 | $280,000 | $264,200 |
| 2020 | $5,359 | $544,200 | $280,000 | $264,200 |
| 2019 | $5,343 | $544,200 | $280,000 | $264,200 |
| 2018 | $5,354 | $402,500 | $190,000 | $212,500 |
| 2017 | $5,273 | $402,500 | $190,000 | $212,500 |
| 2016 | $5,263 | $402,500 | $190,000 | $212,500 |
| 2015 | $5,252 | $402,500 | $190,000 | $212,500 |
| 2014 | $5,232 | $0 | $0 | $0 |
Source: Public Records
Map
Nearby Homes
- 2021 Sablewood Dr
- 2016 Sablewood Dr
- 3119 Knowlton Ln
- 1904 Dearmon Dr
- 1829 Logie Ave
- 1901 Winter St
- 1709 Masonic Dr
- 2314 Wolfe St
- 1625 Club Rd
- 1614 Chatham Ave
- 1609 Chatham Ave
- 1813 Kenwood Ave
- 1615 Chatham Ave
- 1833 Mimosa Ave
- 3125 Loma Ln
- 2209 Norcross Place
- 1304 Queen Lyon Ct
- 2800 Georgia Ave
- 2114 Thurmond Place
- 1646 Arnold Dr
- 2014 Peppercorn Ln
- 2030 Peppercorn Ln
- 2700 Belvedere Ave
- 2820 Saint Andrews Ln
- 2124 Sablewood Dr
- 2120 Sablewood Dr
- 2714 Belvedere Ave
- 2100 Peppercorn Ln
- 2800 Saint Andrews Ln
- 2128 Sablewood Dr
- 2116 Sablewood Dr
- 2112 Sablewood Dr
- 2112 Sablewood Dr Unit 67
- 2035 Peppercorn Ln
- 2108 Sablewood Dr
- 2104 Sablewood Dr
- 2110 Peppercorn Ln
- 2816 Belvedere Ave
- 2321 Club Rd
- 2315 Club Rd