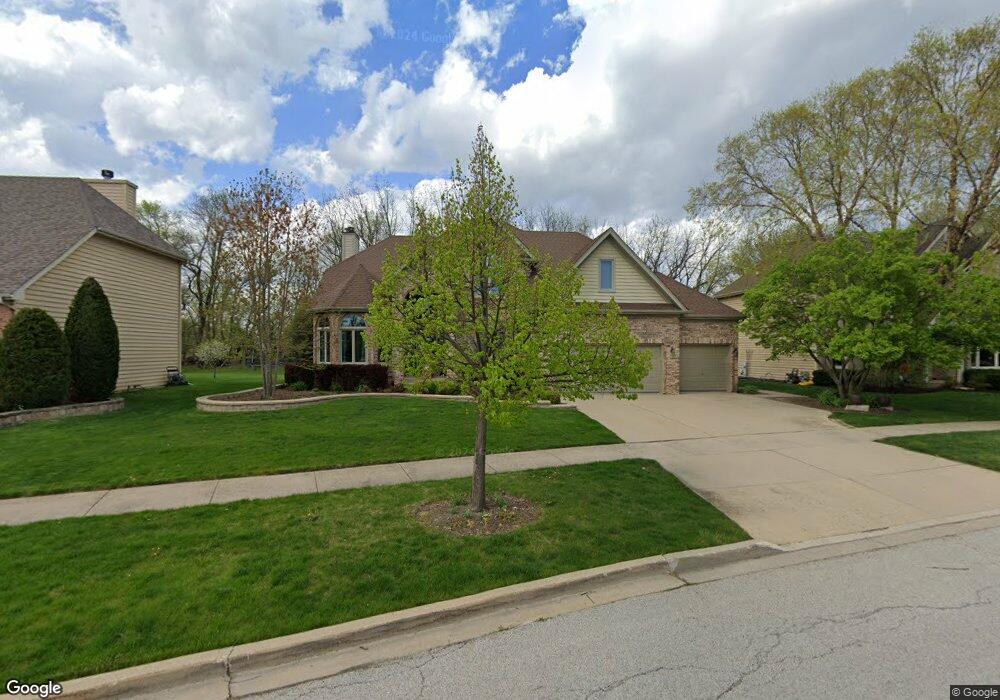
2022 Rachel Ln Aurora, IL 60502
Big Woods Marmion NeighborhoodEstimated Value: $678,000 - $803,000
5
Beds
--
Bath
3,671
Sq Ft
$201/Sq Ft
Est. Value
About This Home
This home is located at 2022 Rachel Ln, Aurora, IL 60502 and is currently estimated at $736,361, approximately $200 per square foot. 2022 Rachel Ln is a home located in Kane County with nearby schools including Louise White Elementary School, Sam Rotolo Middle School, and Batavia Sr High School.
Ownership History
Date
Name
Owned For
Owner Type
Purchase Details
Closed on
Nov 7, 2000
Sold by
Richard David T and Richard Deborah L
Bought by
Lesnik Raymond J and Lesnik Gina B
Current Estimated Value
Home Financials for this Owner
Home Financials are based on the most recent Mortgage that was taken out on this home.
Original Mortgage
$361,250
Outstanding Balance
$131,403
Interest Rate
7.7%
Estimated Equity
$604,958
Purchase Details
Closed on
Aug 27, 1999
Sold by
Sterling Homes Ltd
Bought by
Richard David T and Richard Deborah L
Home Financials for this Owner
Home Financials are based on the most recent Mortgage that was taken out on this home.
Original Mortgage
$288,650
Interest Rate
6.62%
Create a Home Valuation Report for This Property
The Home Valuation Report is an in-depth analysis detailing your home's value as well as a comparison with similar homes in the area
Home Values in the Area
Average Home Value in this Area
Purchase History
| Date | Buyer | Sale Price | Title Company |
|---|---|---|---|
| Lesnik Raymond J | $425,000 | Chicago Title Insurance Co | |
| Richard David T | $349,500 | Chicago Title Insurance Co |
Source: Public Records
Mortgage History
| Date | Status | Borrower | Loan Amount |
|---|---|---|---|
| Open | Lesnik Raymond J | $361,250 | |
| Previous Owner | Richard David T | $288,650 | |
| Closed | Lesnik Raymond J | $21,250 |
Source: Public Records
Tax History Compared to Growth
Tax History
| Year | Tax Paid | Tax Assessment Tax Assessment Total Assessment is a certain percentage of the fair market value that is determined by local assessors to be the total taxable value of land and additions on the property. | Land | Improvement |
|---|---|---|---|---|
| 2024 | $16,374 | $200,846 | $30,081 | $170,765 |
| 2023 | $16,244 | $182,289 | $27,302 | $154,987 |
| 2022 | $15,681 | $170,364 | $25,516 | $144,848 |
| 2021 | $14,531 | $155,033 | $24,200 | $130,833 |
| 2020 | $18,081 | $190,463 | $23,735 | $166,728 |
| 2019 | $17,902 | $183,721 | $22,895 | $160,826 |
| 2018 | $17,146 | $176,723 | $22,023 | $154,700 |
| 2017 | $16,908 | $170,896 | $21,297 | $149,599 |
| 2016 | $16,735 | $165,919 | $20,677 | $145,242 |
| 2015 | -- | $162,141 | $20,206 | $141,935 |
| 2014 | -- | $157,037 | $19,570 | $137,467 |
| 2013 | -- | $158,185 | $23,400 | $134,785 |
Source: Public Records
Map
Nearby Homes
- 2271 Scott Ln Unit 5324
- 2979 Arbor Ln
- 2634 Oakshire Ct
- 2315 Nan St
- 3003 Abbey Cir
- 3075 Mesa Ln
- 3001 Abbey Cir
- 2025 Gillenwater St
- 3S201 S Raddant Rd
- 1942 Tall Oaks Dr Unit 1A
- 1953 Charles Ln Unit 1953
- 1826 N Farnsworth Ave
- 733 Wind Energy Pass
- 1750 N Marywood Ave Unit 315
- 2762 Shetland Ln
- 2428 Ridgewood Ct
- 1155 Hanover Dr
- 1648 Mcclure Rd Unit 814
- 1342 Chillem Dr
- 1425 Mcclure Rd Unit 10
- 2042 Rachel Ln
- 2002 Rachel Ln
- 2755 Ginger Woods Dr Unit 1
- 2062 Rachel Ln
- 2019 Rachel Ln
- 2039 Rachel Ln
- 2765 Ginger Woods Dr
- 2082 Rachel Ln
- 2059 Rachel Ln Unit 1
- 2079 Rachel Ln
- 2760 Ginger Woods Dr
- 2735 Ginger Woods Dr Unit 1
- 2775 Ginger Woods Dr
- 2819 Clarissa Ln
- 2740 Ginger Woods Dr
- 2750 Ginger Woods Dr
- 2770 Ginger Woods Dr
- 2829 Clarissa Ln
- 2730 Ginger Woods Dr
- 2725 Ginger Woods Dr