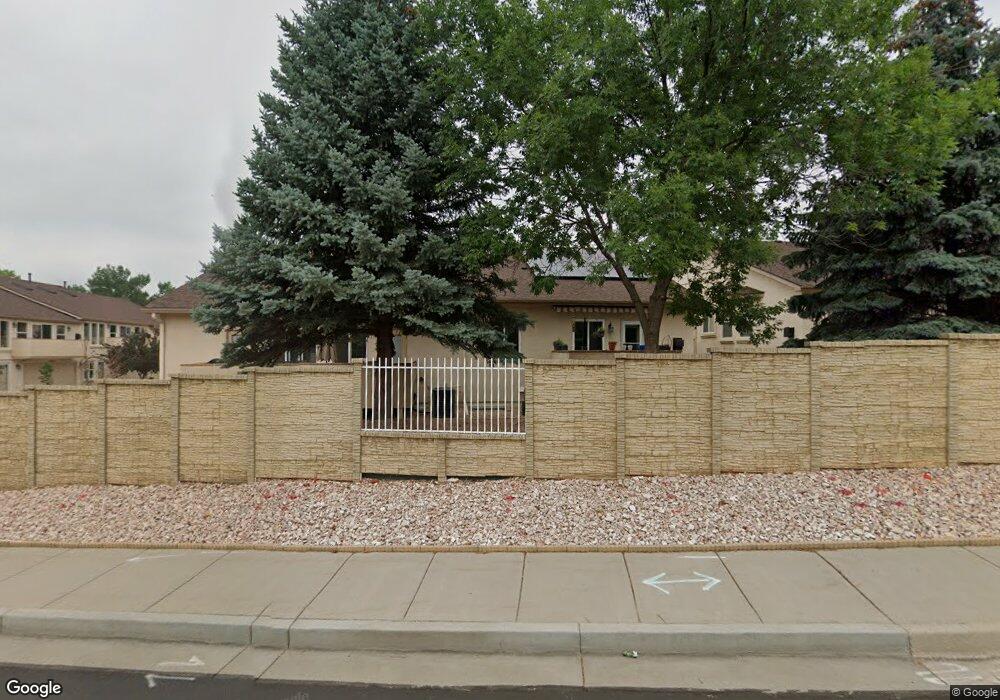
2022 Summerset Dr Colorado Springs, CO 80920
Briargate NeighborhoodEstimated Value: $398,000 - $422,000
3
Beds
3
Baths
1,254
Sq Ft
$327/Sq Ft
Est. Value
About This Home
This home is located at 2022 Summerset Dr, Colorado Springs, CO 80920 and is currently estimated at $410,673, approximately $327 per square foot. 2022 Summerset Dr is a home located in El Paso County with nearby schools including High Plains Elementary School, Mountain Ridge Middle School, and Rampart High School.
Ownership History
Date
Name
Owned For
Owner Type
Purchase Details
Closed on
Jan 12, 2006
Sold by
Brewer David S
Bought by
Buxton Sandra L
Current Estimated Value
Home Financials for this Owner
Home Financials are based on the most recent Mortgage that was taken out on this home.
Original Mortgage
$119,900
Outstanding Balance
$67,313
Interest Rate
6.25%
Mortgage Type
Fannie Mae Freddie Mac
Estimated Equity
$343,360
Purchase Details
Closed on
Jun 6, 2003
Sold by
Hildebrand William C and Hildebrand Diane W
Bought by
Brewer David S
Home Financials for this Owner
Home Financials are based on the most recent Mortgage that was taken out on this home.
Original Mortgage
$147,600
Interest Rate
4.37%
Mortgage Type
Unknown
Purchase Details
Closed on
Sep 6, 1996
Sold by
Calico Homes Inc
Bought by
Hildebrand William C and Hildebrand Diane W
Create a Home Valuation Report for This Property
The Home Valuation Report is an in-depth analysis detailing your home's value as well as a comparison with similar homes in the area
Home Values in the Area
Average Home Value in this Area
Purchase History
| Date | Buyer | Sale Price | Title Company |
|---|---|---|---|
| Buxton Sandra L | $219,900 | Security Title | |
| Brewer David S | $184,500 | North American Title Co | |
| Hildebrand William C | $161,516 | North American Title | |
| Calico Homes Inc | -- | North American Title |
Source: Public Records
Mortgage History
| Date | Status | Borrower | Loan Amount |
|---|---|---|---|
| Open | Buxton Sandra L | $119,900 | |
| Previous Owner | Brewer David S | $147,600 |
Source: Public Records
Tax History Compared to Growth
Tax History
| Year | Tax Paid | Tax Assessment Tax Assessment Total Assessment is a certain percentage of the fair market value that is determined by local assessors to be the total taxable value of land and additions on the property. | Land | Improvement |
|---|---|---|---|---|
| 2025 | $1,555 | $30,140 | -- | -- |
| 2024 | $1,052 | $28,100 | $5,430 | $22,670 |
| 2022 | $1,018 | $21,380 | $3,960 | $17,420 |
| 2021 | $1,127 | $22,000 | $4,080 | $17,920 |
| 2020 | $1,013 | $19,590 | $3,000 | $16,590 |
| 2019 | $1,578 | $19,590 | $3,000 | $16,590 |
| 2018 | $1,533 | $18,720 | $2,810 | $15,910 |
| 2017 | $1,528 | $18,720 | $2,810 | $15,910 |
| 2016 | $1,443 | $17,660 | $2,630 | $15,030 |
| 2015 | $1,441 | $17,660 | $2,630 | $15,030 |
| 2014 | $1,395 | $17,090 | $2,630 | $14,460 |
Source: Public Records
Map
Nearby Homes
- 2006 Summerset Dr
- 2114 Summerset Dr
- 2068 Silkwood Dr
- 8161 Regiment Ct
- 1932 Silkwood Dr
- 1931 London Carriage Grove
- 8335 Sutterfield Dr
- 2270 Cloverdale Dr
- 2110 Whitehorn Dr N
- 1880 Independence Dr
- 2326 Parliament Dr
- 1907 Independence Dr
- 2512 Elite Terrace
- 2340 Winstead View
- 2632 Marston Heights
- 2615 Thrush Grove
- 2680 Norwich Dr
- 2644 Marston Heights
- 1884 Fuller Rd
- 7849 Flicker Grove
- 2020 Summerset Dr
- 2024 Summerset Dr
- 2026 Summerset Dr
- 2012 Summerset Dr
- 2010 Summerset Dr
- 2014 Summerset Dr
- 2040 Summerset Dr
- 2042 Summerset Dr
- 2036 Summerset Dr
- 2016 Summerset Dr
- 2044 Summerset Dr
- 2056 Summerset Dr
- 2034 Summerset Dr
- 2058 Summerset Dr
- 2004 Summerset Dr
- 2002 Summerset Dr
- 2032 Summerset Dr
- 2062 Summerset Dr
- 2050 Summerset Dr
- 2030 Summerset Dr