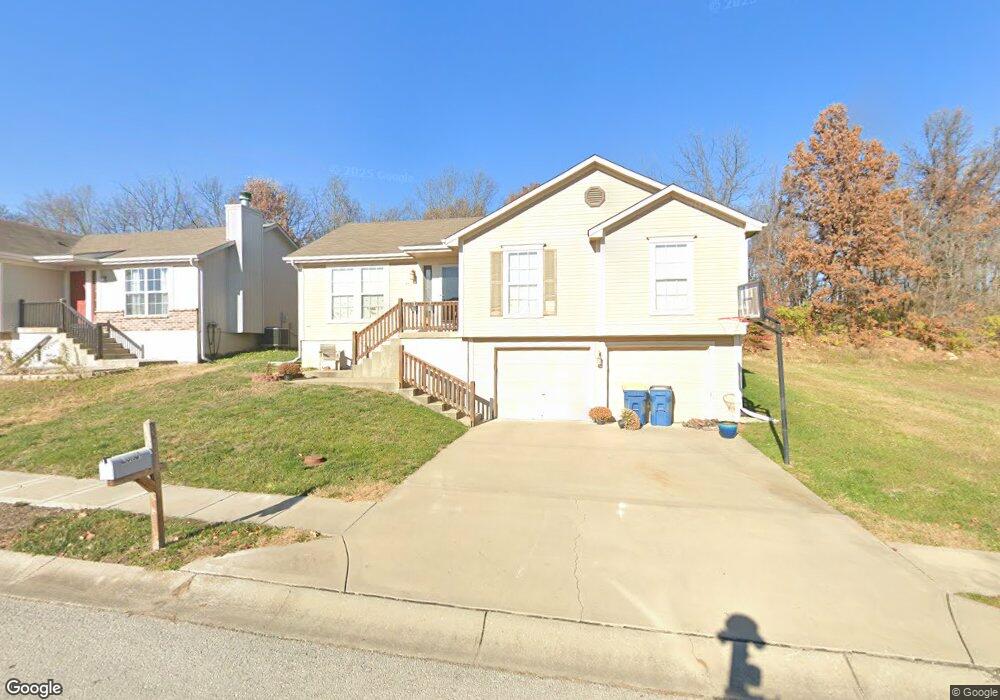
2022 W Springs Way Excelsior Springs, MO 64024
Estimated Value: $288,648 - $341,000
3
Beds
2
Baths
1,372
Sq Ft
$225/Sq Ft
Est. Value
About This Home
This home is located at 2022 W Springs Way, Excelsior Springs, MO 64024 and is currently estimated at $308,912, approximately $225 per square foot. 2022 W Springs Way is a home located in Clay County with nearby schools including Excelsior Springs High School.
Ownership History
Date
Name
Owned For
Owner Type
Purchase Details
Closed on
Dec 3, 2020
Sold by
Lynn Jeremy
Bought by
Long Katelyn
Current Estimated Value
Purchase Details
Closed on
Dec 26, 2006
Sold by
North Valley Homes Inc
Bought by
Lynn Jeremy D and Lynn Katelyn R
Home Financials for this Owner
Home Financials are based on the most recent Mortgage that was taken out on this home.
Original Mortgage
$142,848
Interest Rate
6.27%
Mortgage Type
Purchase Money Mortgage
Purchase Details
Closed on
Apr 5, 2005
Sold by
Pursell Holdings Llc
Bought by
North Valley Homes Inc
Home Financials for this Owner
Home Financials are based on the most recent Mortgage that was taken out on this home.
Original Mortgage
$114,367
Interest Rate
5.75%
Mortgage Type
Construction
Create a Home Valuation Report for This Property
The Home Valuation Report is an in-depth analysis detailing your home's value as well as a comparison with similar homes in the area
Home Values in the Area
Average Home Value in this Area
Purchase History
| Date | Buyer | Sale Price | Title Company |
|---|---|---|---|
| Long Katelyn | -- | None Available | |
| Lynn Jeremy D | -- | United Title Company Inc | |
| North Valley Homes Inc | -- | United Title Company Inc |
Source: Public Records
Mortgage History
| Date | Status | Borrower | Loan Amount |
|---|---|---|---|
| Previous Owner | Lynn Jeremy D | $142,848 | |
| Previous Owner | North Valley Homes Inc | $114,367 |
Source: Public Records
Tax History Compared to Growth
Tax History
| Year | Tax Paid | Tax Assessment Tax Assessment Total Assessment is a certain percentage of the fair market value that is determined by local assessors to be the total taxable value of land and additions on the property. | Land | Improvement |
|---|---|---|---|---|
| 2025 | $2,694 | $42,730 | -- | -- |
| 2024 | $2,694 | $38,420 | -- | -- |
| 2023 | $2,678 | $38,420 | $0 | $0 |
| 2022 | $2,263 | $31,940 | $0 | $0 |
| 2021 | $2,272 | $31,939 | $3,800 | $28,139 |
| 2020 | $2,161 | $29,530 | $0 | $0 |
| 2019 | $2,159 | $29,530 | $0 | $0 |
| 2018 | $2,048 | $27,930 | $0 | $0 |
| 2017 | $1,998 | $27,930 | $4,180 | $23,750 |
| 2016 | $1,998 | $27,930 | $4,180 | $23,750 |
| 2015 | $2,016 | $27,930 | $4,180 | $23,750 |
| 2014 | $2,034 | $27,930 | $4,180 | $23,750 |
Source: Public Records
Map
Nearby Homes
- 610 Caitlin Ct
- 614 Caitlin Ct
- 606 Patrick Dr
- 0 Mccleary Rd Unit HMS2499816
- 25810 H Hwy
- 2210 Piedmont Place
- 2305 Arbor Ln
- 2021 Riverstone Dr
- 12409 Morgan St
- 240 Rock Bridge Pkwy
- 1219 Paton St
- 2207 Ashford St
- 2081 Rock Bridge Pkwy
- 0 NE 124th St Unit HMS2592163
- 402 Leslie Ln
- 125 Crown Hill Rd
- 402 Greenspire St
- 130 Kevin St
- 1113 Melanie Ln
- 2017 Karlton Way
- 2024 W Springs Way
- Lot 18 W Springs Way
- Lot 45 W Springs Way
- 2026 W Springs Way
- 2017 W Springs Way
- 2015 W Springs Way
- 2028 W Springs Way
- 2019 W Springs Way
- 2021 Buckeye Ct
- 2013 W Springs Way
- 2031 Buckeye Ct
- 2023 Buckeye Ct
- 2012 W Springs Way
- 2033 W Springs Way
- 2025 Buckeye Ct
- 2029 Buckeye Ct
- 2035 W Springs Way
- 2027 Buckeye Ct
- 2036 W Springs Way
- 2037 W Springs Way