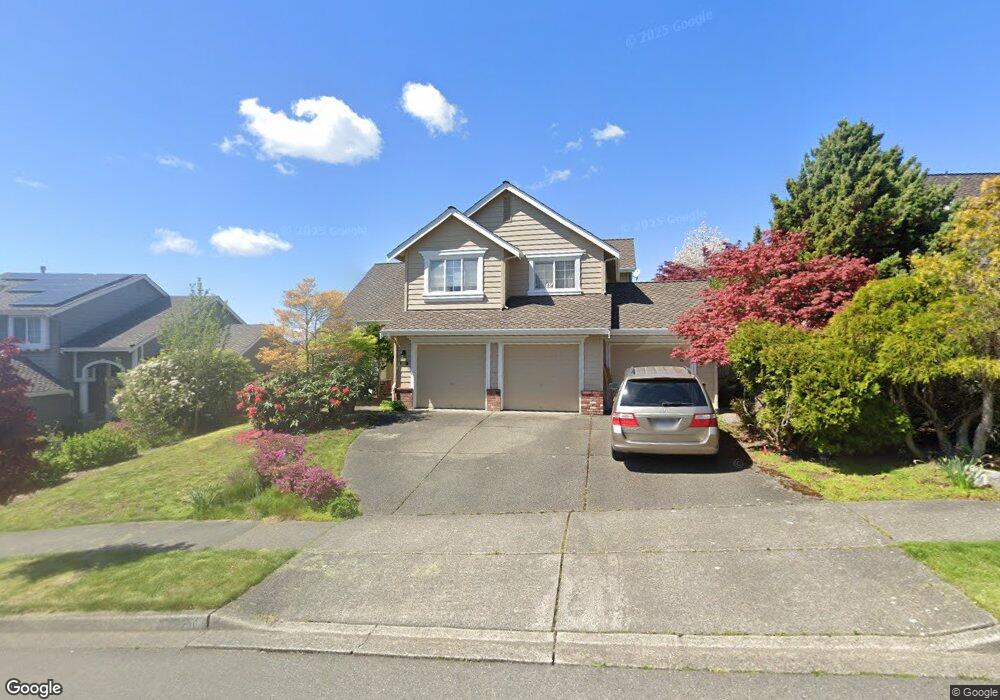
20220 29th Ave SE Bothell, WA 98012
Thrasher's Corner-Red Hawk NeighborhoodEstimated Value: $1,252,347 - $1,280,000
4
Beds
3
Baths
2,436
Sq Ft
$519/Sq Ft
Est. Value
About This Home
This home is located at 20220 29th Ave SE, Bothell, WA 98012 and is currently estimated at $1,264,337, approximately $519 per square foot. 20220 29th Ave SE is a home located in Snohomish County with nearby schools including Canyon Creek Elementary School, Skyview Middle School, and North Creek High School.
Ownership History
Date
Name
Owned For
Owner Type
Purchase Details
Closed on
Nov 7, 2005
Sold by
Rust Michael B and Rust Kathleen K
Bought by
Xia Yue and Wu Lan
Current Estimated Value
Home Financials for this Owner
Home Financials are based on the most recent Mortgage that was taken out on this home.
Original Mortgage
$60,000
Outstanding Balance
$31,405
Interest Rate
5.9%
Mortgage Type
Credit Line Revolving
Estimated Equity
$1,232,932
Purchase Details
Closed on
May 13, 1997
Sold by
John F Buchan Construction Inc
Bought by
Rust Michael B and Rust Kathleen K
Home Financials for this Owner
Home Financials are based on the most recent Mortgage that was taken out on this home.
Original Mortgage
$214,600
Interest Rate
8.15%
Create a Home Valuation Report for This Property
The Home Valuation Report is an in-depth analysis detailing your home's value as well as a comparison with similar homes in the area
Home Values in the Area
Average Home Value in this Area
Purchase History
| Date | Buyer | Sale Price | Title Company |
|---|---|---|---|
| Xia Yue | $460,000 | The Talon Group | |
| Rust Michael B | $271,950 | Chicago Title Ins Co |
Source: Public Records
Mortgage History
| Date | Status | Borrower | Loan Amount |
|---|---|---|---|
| Open | Xia Yue | $60,000 | |
| Open | Xia Yue | $351,500 | |
| Previous Owner | Rust Michael B | $214,600 |
Source: Public Records
Tax History
| Year | Tax Paid | Tax Assessment Tax Assessment Total Assessment is a certain percentage of the fair market value that is determined by local assessors to be the total taxable value of land and additions on the property. | Land | Improvement |
|---|---|---|---|---|
| 2026 | $9,760 | $1,205,600 | $814,800 | $390,800 |
| 2025 | $8,269 | $1,162,100 | $786,500 | $375,600 |
| 2024 | $8,269 | $989,500 | $627,000 | $362,500 |
| 2023 | $8,770 | $1,143,800 | $725,000 | $418,800 |
| 2022 | $7,630 | $795,500 | $440,000 | $355,500 |
| 2020 | $7,866 | $764,600 | $414,000 | $350,600 |
| 2019 | $6,802 | $677,200 | $330,000 | $347,200 |
| 2018 | $6,336 | $594,800 | $285,000 | $309,800 |
| 2017 | $5,412 | $522,200 | $230,000 | $292,200 |
| 2016 | $5,241 | $490,000 | $210,000 | $280,000 |
| 2015 | $5,151 | $453,400 | $195,000 | $258,400 |
| 2013 | $4,739 | $362,500 | $157,000 | $205,500 |
Source: Public Records
Map
Nearby Homes
- 20501 31st Dr SE
- 20500 32nd Dr SE
- 20524 32nd Dr SE
- 3422 201st Place SE
- 19911 34th Dr SE
- 19520 Grannis Rd
- 3323 207th Place SE
- 2408 208th Place SE
- 20911 30th Dr SE
- 3618 202nd St SE
- 2115 201st Place SE Unit F4
- 2115 201st Place SE Unit K2
- 2115 201st Place SE Unit H3
- 2115 201st Place SE Unit L2
- 2200 196th St SE Unit 25
- 2200 196th St SE Unit 66
- 2200 196th St SE Unit 76
- 2200 196th St SE Unit 61
- 2200 196th St SE Unit 70
- 3604 198th St SE
- 20216 29th Ave SE
- 20224 29th Ave SE
- 20215 28th Ave SE
- 20212 29th Ave SE
- 20219 28th Ave SE
- 20230 29th Ave SE
- 20210 29th Ave SE
- 2826 202nd St SE
- 2823 204th St SE
- 20211 28th Ave SE
- 20221 29th Ave SE
- 20225 29th Ave SE
- 20229 29th Ave SE
- 20206 29th Ave SE
- 20217 29th Ave SE
- 20227 28th Ave SE
- 20212 28th Ave SE
- 2822 202nd St SE
- 2919 204th St SE
Your Personal Tour Guide
Ask me questions while you tour the home.